Cabela's 2009 Annual Report Download - page 94
Download and view the complete annual report
Please find page 94 of the 2009 Cabela's annual report below. You can navigate through the pages in the report by either clicking on the pages listed below, or by using the keyword search tool below to find specific information within the annual report.-
 1
1 -
2
-
3
-
4
-
5
-
6
-
7
-
8
-
9
-
10
-
11
-
12
-
13
-
14
-
15
-
16
-
17
-
18
-
19
-
20
-
21
-
22
-
23
-
24
-
25
-
26
-
27
-
28
-
29
-
30
-
31
-
32
-
33
-
34
-
35
-
36
-
37
-
38
-
39
-
40
-
41
-
42
-
43
-
44
-
45
-
46
-
47
-
48
-
49
-
50
-
51
-
52
-
53
-
54
-
55
-
56
-
57
-
58
-
59
-
60
-
61
-
62
-
63
-
64
-
65
-
66
-
67
-
68
-
69
-
70
-
71
-
72
-
73
-
74
-
75
-
76
-
77
-
78
-
79
-
80
-
81
-
82
-
83
-
 84
84 -
 85
85 -
 86
86 -
 87
87 -
 88
88 -
 89
89 -
 90
90 -
 91
91 -
 92
92 -
 93
93 -
 94
94 -
 95
95 -
 96
96 -
 97
97 -
 98
98 -
 99
99 -
 100
100 -
 101
101 -
 102
102 -
 103
103 -
 104
104 -
105
-
106
-
107
-
108
-
109
-
110
-
111
-
112
-
113
-
114
-
115
-
116
-
117
-
118
-
119
-
120
-
121
-
122
-
123
-
124
-
125
-
126
-
127
-
128
-
129
-
130
-
131
 |
 |

85
CABELA’S INCORPORATED AND SUBSIDIARIES
NOTES TO CONSOLIDATED FINANCIAL STATEMENTS
(Dollars in Thousands Except Share and Per Share Amounts)
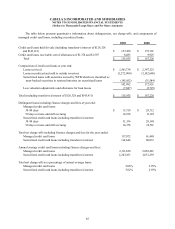
The table below presents quantitative information about delinquencies, net charge-offs, and components of
managed credit card loans, including securitized loans:
2009 2008
Credit card loans held for sale (including transferor’s interest of $126,328
and $143,411) $ 127,450 $157,301
Credit card loans receivable, net of allowances of $1,374 and $1,507 8,485 9,925
Total $135,935 $167,226
Composition of credit card loans at year end:
Loans serviced $ 2,561,734 $2,347,223
Loans securitized and sold to outside investors (2,272,900)(2,142,688)
Securitized loans with securities owned by WFB which are classified as
asset-backed securities in retained interests on securitized loans (145,852)(31,584)
142,982 172,951
Less valuation adjustments and allowance for loan losses (7,047)(5,725)
Total (including transferor’s interest of $126,328 and $143,411) $ 135,935 $167,226
Delinquent loans including finance charges and fees at year end:
Managed credit card loans:
30-89 days $ 31,719 $28,712
90 days or more and still accruing 14,536 11,145
Securitized credit card loans including transferor’s interest:
30-89 days 31,336 28,148
90 days or more and still accruing 14,376 10,761
Total net charge-offs including finance charges and fees for the year ended:
Managed credit card loans 117,072 61,448
Securitized credit card loans including transferor’s interest 114,644 60,033
Annual average credit card loans including finance charges and fees:
Managed credit card loans 2,311,820 2,085,481
Securitized credit card loans including transferor’s interest 2,283,103 2,051,295
Total net charge-offs as a percentage of annual average loans:
Managed credit card loans 5.06%2.95%
Securitized credit card loans including transferor’s interest 5.02%2.93%