Cabela's 2009 Annual Report Download - page 79
Download and view the complete annual report
Please find page 79 of the 2009 Cabela's annual report below. You can navigate through the pages in the report by either clicking on the pages listed below, or by using the keyword search tool below to find specific information within the annual report.-
 1
1 -
2
-
3
-
4
-
5
-
6
-
7
-
8
-
9
-
10
-
11
-
12
-
13
-
14
-
15
-
16
-
17
-
18
-
19
-
20
-
21
-
22
-
23
-
24
-
25
-
26
-
27
-
28
-
29
-
30
-
31
-
32
-
33
-
34
-
35
-
36
-
37
-
38
-
39
-
40
-
41
-
42
-
43
-
44
-
45
-
46
-
47
-
48
-
49
-
50
-
51
-
52
-
53
-
54
-
55
-
56
-
57
-
58
-
59
-
60
-
61
-
62
-
63
-
64
-
65
-
66
-
67
-
68
-
 69
69 -
 70
70 -
 71
71 -
 72
72 -
 73
73 -
 74
74 -
 75
75 -
 76
76 -
 77
77 -
 78
78 -
 79
79 -
 80
80 -
 81
81 -
 82
82 -
 83
83 -
 84
84 -
 85
85 -
 86
86 -
 87
87 -
 88
88 -
 89
89 -
90
-
91
-
92
-
93
-
94
-
95
-
96
-
97
-
98
-
99
-
100
-
101
-
102
-
103
-
104
-
105
-
106
-
107
-
108
-
109
-
110
-
111
-
112
-
113
-
114
-
115
-
116
-
117
-
118
-
119
-
120
-
121
-
122
-
123
-
124
-
125
-
126
-
127
-
128
-
129
-
130
-
131
 |
 |

70
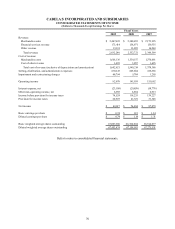
CABELA’S INCORPORATED AND SUBSIDIARIES
CONSOLIDATED STATEMENTS OF INCOME
(Dollars in Thousands Except Earnings Per Share)
Fiscal Years
2009 2008 2007
Revenue:
Merchandise sales $ 2,447,635 $2,380,655 $2,173,995
Financial services revenue 171,414 158,971 159,335
Other revenue 13,191 13,095 16,269
Total revenue 2,632,240 2,552,721 2,349,599
Cost of revenue:
Merchandise costs 1,601,136 1,539,157 1,376,691
Cost of other revenue 1,485 1,057 1,695
Total cost of revenue (exclusive of depreciation and amortization) 1,602,621 1,540,214 1,378,386
Selling, distribution, and administrative expenses 870,147 865,684 818,916
Impairment and restructuring charges 66,794 5,784 1,205
Operating income 92,678 141,039 151,092
Interest expense, net (23,109)(29,658)(18,778)
Other non-operating income, net 6,955 6,854 6,913
Income before provision for income taxes 76,524 118,235 139,227
Provision for income taxes 26,907 41,831 51,348
Net income $ 49,617 $76,404 $87,879
Basic earnings per share $ 0.74 $1.15 $1.34
Diluted earnings per share $ 0.74 $1.14 $1.31
Basic weighted average shares outstanding 67,007,656 66,384,004 65,744,077
Diluted weighted average shares outstanding 67,453,474 67,158,583 67,275,531
Refer to notes to consolidated financial statements.