Cabela's 2009 Annual Report Download - page 113
Download and view the complete annual report
Please find page 113 of the 2009 Cabela's annual report below. You can navigate through the pages in the report by either clicking on the pages listed below, or by using the keyword search tool below to find specific information within the annual report.-
 1
1 -
2
-
3
-
4
-
5
-
6
-
7
-
8
-
9
-
10
-
11
-
12
-
13
-
14
-
15
-
16
-
17
-
18
-
19
-
20
-
21
-
22
-
23
-
24
-
25
-
26
-
27
-
28
-
29
-
30
-
31
-
32
-
33
-
34
-
35
-
36
-
37
-
38
-
39
-
40
-
41
-
42
-
43
-
44
-
45
-
46
-
47
-
48
-
49
-
50
-
51
-
52
-
53
-
54
-
55
-
56
-
57
-
58
-
59
-
60
-
61
-
62
-
63
-
64
-
65
-
66
-
67
-
68
-
69
-
70
-
71
-
72
-
73
-
74
-
75
-
76
-
77
-
78
-
79
-
80
-
81
-
82
-
83
-
84
-
85
-
86
-
87
-
88
-
89
-
90
-
91
-
92
-
93
-
94
-
95
-
96
-
97
-
98
-
99
-
100
-
101
-
102
-
 103
103 -
 104
104 -
 105
105 -
 106
106 -
 107
107 -
 108
108 -
 109
109 -
 110
110 -
 111
111 -
 112
112 -
 113
113 -
 114
114 -
 115
115 -
 116
116 -
 117
117 -
 118
118 -
 119
119 -
 120
120 -
 121
121 -
 122
122 -
 123
123 -
124
-
125
-
126
-
127
-
128
-
129
-
130
-
131
 |
 |

104
CABELA’S INCORPORATED AND SUBSIDIARIES
NOTES TO CONSOLIDATED FINANCIAL STATEMENTS
(Dollars in Thousands Except Share and Per Share Amounts)
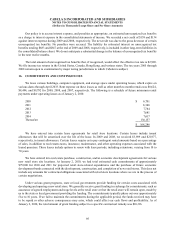
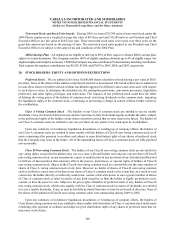
The components and amounts of total revenue for the Financial Services business segment were as follows for
the years ended:
2009 2008 2007
Interest and fee income, net of provision for loan losses $ 50,398 $37,462 $28,974
Interest expense (24,242)(13,417)(7,288)
Net interest income, net of provision for loan losses 26,156 24,045 21,686
Non-interest income:
Securitization income 197,335 185,820 194,516
Other non-interest income 67,589 67,375 51,670
Total non-interest income 264,924 253,195 246,186
Less: Customer rewards costs (119,666)(118,269)(108,537)
Financial Services total revenue $ 171,414 $158,971 $159,335
Our products are principally marketed to individuals within the United States. Net sales realized from other
geographic markets, primarily Canada, have collectively been less than 3% of consolidated net merchandise sales in
each reported period. No single customer accounted for 10% or more of consolidated net sales. No single product or
service accounts for a significant percentage of our consolidated revenue.
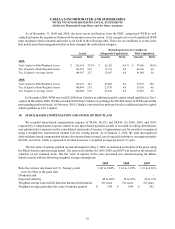
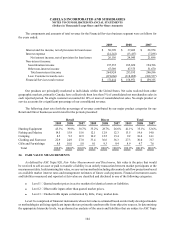
The following chart sets forth the percentage of revenue contributed by our major product categories for our
Retail and Direct businesses and in total for the periods presented:
Retail Direct Total
2009 2008 2007 2009 2008 2007 2009 2008 2007
Hunting Equipment 45.3%39.9%38.7%35.2%28.7%26.6%41.1%35.1%32.6%
Fishing and Marine 14.5 15.9 15.6 12.1 12.9 12.3 13.5 14.6 14.0
Camping 8.5 9.3 12.9 10.2 12.5 15.4 9.2 10.614.1
Clothing and Footwear 22.9 24.9 27.0 33.4 36.6 36.3 27.3 30.0 31.7
Gifts and Furnishings 8.8 10.0 5.8 9.19.3 9.4 8.9 9.7 7.6
Total 100.0%100.0%100.0%100.0%100.0%100.0%100.0%100.0%100.0%
24. FAIR VALUE MEASUREMENTS
As defined by ASC Topic 820, Fair Value Measurements and Disclosures, fair value is the price that would
be received to sell an asset or paid to transfer a liability in an orderly transaction between market participants at the
measurement date. In determining fair value, we use various methods including discounted cash flow projections based
on available market interest rates and management estimates of future cash payments. Financial instrument assets
and liabilities measured and reported at fair value are classified and disclosed in one of the following categories:
• Level 1 – Quoted market prices in active markets for identical assets or liabilities.
• Level 2 – Observable inputs other than quoted market prices.
• Level 3 – Unobservable inputs corroborated by little, if any, market data.
Level 3 is comprised of financial instruments whose fair value is estimated based on internally developed models
or methodologies utilizing significant inputs that are primarily unobservable from objective sources. In determining
the appropriate hierarchy levels, we performed an analysis of the assets and liabilities that are subject to ASC Topic