Cabela's 2009 Annual Report Download - page 41
Download and view the complete annual report
Please find page 41 of the 2009 Cabela's annual report below. You can navigate through the pages in the report by either clicking on the pages listed below, or by using the keyword search tool below to find specific information within the annual report.-
 1
1 -
2
-
3
-
4
-
5
-
6
-
7
-
8
-
9
-
10
-
11
-
12
-
13
-
14
-
15
-
16
-
17
-
18
-
19
-
20
-
21
-
22
-
23
-
24
-
25
-
26
-
27
-
28
-
29
-
30
-
 31
31 -
 32
32 -
 33
33 -
 34
34 -
 35
35 -
 36
36 -
 37
37 -
 38
38 -
 39
39 -
 40
40 -
 41
41 -
 42
42 -
 43
43 -
 44
44 -
 45
45 -
 46
46 -
 47
47 -
 48
48 -
 49
49 -
 50
50 -
 51
51 -
52
-
53
-
54
-
55
-
56
-
57
-
58
-
59
-
60
-
61
-
62
-
63
-
64
-
65
-
66
-
67
-
68
-
69
-
70
-
71
-
72
-
73
-
74
-
75
-
76
-
77
-
78
-
79
-
80
-
81
-
82
-
83
-
84
-
85
-
86
-
87
-
88
-
89
-
90
-
91
-
92
-
93
-
94
-
95
-
96
-
97
-
98
-
99
-
100
-
101
-
102
-
103
-
104
-
105
-
106
-
107
-
108
-
109
-
110
-
111
-
112
-
113
-
114
-
115
-
116
-
117
-
118
-
119
-
120
-
121
-
122
-
123
-
124
-
125
-
126
-
127
-
128
-
129
-
130
-
131
 |
 |

32
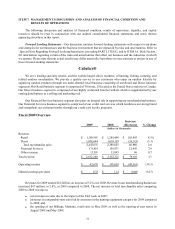
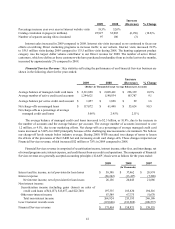
Partially offsetting these increases in merchandise sales was a net decrease in Direct revenue as sales transition
to our retail stores. Financial Services revenue increased $12 million, or 7.8%, in 2009 compared to 2008 primarily
due to increases in securitization income and net interest income.
Operating income for 2009 decreased $49 million, or 34.5%, compared to 2008. The decreases in total operating
income and total operating income as a percentage of total revenue were primarily due to:
• asset impairment charges totaling $62 million and retirement and severance benefits totaling $5 million
recorded in 2009, compared to asset impairment charges of $4 million and retirement and severance
benefits of $2 million recorded in 2008;
• lower revenue from our Direct business segment which was partially mitigated by a planned decrease in
catalog and Internet related marketing costs and to a managed reduction in catalog page count;
• lower merchandise gross margin; and
• a net decrease in breakage revenue on gift instruments redeemed for merchandise or services.
These decreases in total operating income were partially offset by increases in revenue from our Retail business
and Financial Services segments and improved efficiencies in labor productivity and advertising in our Retail
business. In 2009, we finalized plans on certain existing and future retail store sites, and consequently evaluated the
recoverability of related properties and improvements resulting in the recognition of write-downs related to these
assets totaling $57 million. For 2009, we recorded total asset impairment charges of $62 million and severance and
related benefits of $5 million. Economic trends could change undiscounted cash flows in future periods which could
trigger possible future write downs.
Fiscal 2009 consisted of 53 weeks and fiscal 2008 consisted of 52 weeks. The table below presents results
for 2009 excluding the effect of revenue earned in the last week of 2009 in order to show comparable data with
results in 2008. Management believes these non-GAAP financial results provide useful supplemental information to
investors regarding revenues and trends and performance of our ongoing operations and are useful for year-over-year
comparisons of such results. In addition, management evaluates results using non-GAAP adjusted total revenue.
These non-GAAP results should not be considered in isolation or as a substitute for total revenue calculated in
accordance with GAAP. Financial Services was not adjusted because its reporting periods end on a calendar year.
2009
(Excluding
53rd Week) 2008 Increase
(Decrease) % Change
(Dollars in Thousands)
Revenue:
Retail $1,354,983 $1,285,496 $69,487 5.4%
Direct 1,041,389 1,095,159 (53,770)(4.9)
Total merchandise sales 2,396,372 2,380,655 15,717 0.7
Financial Services 171,414 158,971 12,443 7.8
Other revenue 13,010 13,095 (85)(0.6)
Total revenue (non-GAAP basis) 2,580,796 2,552,721 28,075 1.1
Total revenue - week 53 51,444 -51,444
Total revenue (GAAP basis) $ 2,632,240 $2,552,721 $79,519 3.1
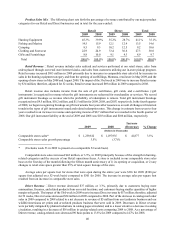
The impact of the 53rd week in 2009 was to increase total revenues and revenue from our merchandising
businesses by $51 million. Adjusting to be on a comparable 52-week year, revenues for 2009 totaled $2.6 billion, an
increase of 1.1% over 2008, and revenue in our merchandising businesses for 2009 increased $16 million, or 0.7%,
compared to 2008. The net increase in total merchandise sales comparing 2009 to 2008 was due to 1) increases in
comparable store sales led by increases in the hunting equipment category for 2009 compared to 2008; 2) the opening
of our Billings, Montana, retail store in May 2009; and 3) increases in Internet sales.