Humana 2010 Annual Report Download - page 104
Download and view the complete annual report
Please find page 104 of the 2010 Humana annual report below. You can navigate through the pages in the report by either clicking on the pages listed below, or by using the keyword search tool below to find specific information within the annual report.-
 1
1 -
2
-
3
-
4
-
5
-
6
-
7
-
8
-
9
-
10
-
11
-
12
-
13
-
14
-
15
-
16
-
17
-
18
-
19
-
20
-
21
-
22
-
23
-
24
-
25
-
26
-
27
-
28
-
29
-
30
-
31
-
32
-
33
-
34
-
35
-
36
-
37
-
38
-
39
-
40
-
41
-
42
-
43
-
44
-
45
-
46
-
47
-
48
-
49
-
50
-
51
-
52
-
53
-
54
-
55
-
56
-
57
-
58
-
59
-
60
-
61
-
62
-
63
-
64
-
65
-
66
-
67
-
68
-
69
-
70
-
71
-
72
-
73
-
74
-
75
-
76
-
77
-
78
-
79
-
80
-
81
-
82
-
83
-
84
-
85
-
86
-
87
-
88
-
89
-
90
-
91
-
92
-
93
-
 94
94 -
 95
95 -
 96
96 -
 97
97 -
 98
98 -
 99
99 -
 100
100 -
 101
101 -
 102
102 -
 103
103 -
 104
104 -
 105
105 -
 106
106 -
 107
107 -
 108
108 -
 109
109 -
 110
110 -
 111
111 -
 112
112 -
 113
113 -
 114
114 -
115
-
116
-
117
-
118
-
119
-
120
-
121
-
122
-
123
-
124
-
125
-
126
-
127
-
128
-
129
-
130
-
131
-
132
-
133
-
134
-
135
-
136
-
137
-
138
-
139
-
140
-
141
-
142
-
143
-
144
-
145
-
146
-
147
-
148
-
149
-
150
-
151
-
152
 |
 |

Humana Inc.
NOTES TO CONSOLIDATED FINANCIAL STATEMENTS—(Continued)
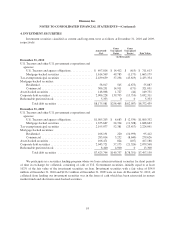
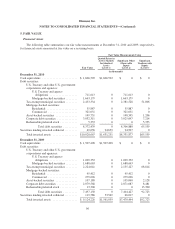
Gross unrealized losses and fair values aggregated by investment category and length of time that individual
securities have been in a continuous unrealized loss position were as follows at December 31, 2010 and 2009,
respectively:
Less than 12 months 12 months or more Total
Fair
Value
Gross
Unrealized
Losses
Fair
Value
Gross
Unrealized
Losses
Fair
Value
Gross
Unrealized
Losses
(in thousands)
December 31, 2010
U.S. Treasury and other U.S.
government corporations and
agencies:
U.S. Treasury and agency
obligations .............. $ 141,766 $ (615) $ 0 $ 0 $ 141,766 $ (615)
Mortgage-backed securities . . . 110,358 (1,054) 5,557 (119) 115,915 (1,173)
Tax-exempt municipal securities . . . 1,168,221 (33,218) 97,809 (10,401) 1,266,030 (43,619)
Mortgage-backed securities: ......
Residential ................ 0 0 32,671 (2,675) 32,671 (2,675)
Commercial ............... 0 0 2,752 (171) 2,752 (171)
Asset-backed securities .......... 17,069 (42) 283 (2) 17,352 (44)
Corporate debt securities ......... 383,677 (9,572) 31,464 (4,138) 415,141 (13,710)
Total debt securities ..... $1,821,091 $(44,501) $170,536 $(17,506) $1,991,627 $(62,007)
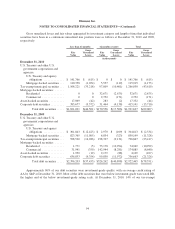
December 31, 2009
U.S. Treasury and other U.S.
government corporations and
agencies:
U.S. Treasury and agency
obligations .............. $ 301,843 $ (2,425) $ 2,970 $ (109) $ 304,813 $ (2,534)
Mortgage-backed securities . . . 823,365 (11,005) 6,834 (323) 830,199 (11,328)
Tax-exempt municipal securities . . . 598,520 (14,286) 198,327 (9,131) 796,847 (23,417)
Mortgage-backed securities: ......
Residential ................ 1,771 (5) 73,178 (10,994) 74,949 (10,999)
Commercial ............... 31,941 (359) 142,944 (8,281) 174,885 (8,640)
Asset-backed securities .......... 1,930 (19) 2,179 (88) 4,109 (107)
Corporate debt securities ......... 636,833 (9,354) 99,830 (11,972) 736,663 (21,326)
Total debt securities ..... $2,396,203 $(37,453) $526,262 $(40,898) $2,922,465 $(78,351)
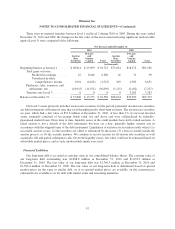
Approximately 96% of our debt securities were investment-grade quality, with an average credit rating of
AA by S&P at December 31, 2010. Most of the debt securities that were below investment-grade were rated BB,
the higher end of the below investment-grade rating scale. At December 31, 2010, 14% of our tax-exempt
94