Humana 2010 Annual Report Download - page 23
Download and view the complete annual report
Please find page 23 of the 2010 Humana annual report below. You can navigate through the pages in the report by either clicking on the pages listed below, or by using the keyword search tool below to find specific information within the annual report.-
 1
1 -
2
-
3
-
4
-
5
-
6
-
7
-
8
-
9
-
10
-
11
-
12
-
 13
13 -
 14
14 -
 15
15 -
 16
16 -
 17
17 -
 18
18 -
 19
19 -
 20
20 -
 21
21 -
 22
22 -
 23
23 -
 24
24 -
 25
25 -
 26
26 -
 27
27 -
 28
28 -
 29
29 -
 30
30 -
 31
31 -
 32
32 -
 33
33 -
34
-
35
-
36
-
37
-
38
-
39
-
40
-
41
-
42
-
43
-
44
-
45
-
46
-
47
-
48
-
49
-
50
-
51
-
52
-
53
-
54
-
55
-
56
-
57
-
58
-
59
-
60
-
61
-
62
-
63
-
64
-
65
-
66
-
67
-
68
-
69
-
70
-
71
-
72
-
73
-
74
-
75
-
76
-
77
-
78
-
79
-
80
-
81
-
82
-
83
-
84
-
85
-
86
-
87
-
88
-
89
-
90
-
91
-
92
-
93
-
94
-
95
-
96
-
97
-
98
-
99
-
100
-
101
-
102
-
103
-
104
-
105
-
106
-
107
-
108
-
109
-
110
-
111
-
112
-
113
-
114
-
115
-
116
-
117
-
118
-
119
-
120
-
121
-
122
-
123
-
124
-
125
-
126
-
127
-
128
-
129
-
130
-
131
-
132
-
133
-
134
-
135
-
136
-
137
-
138
-
139
-
140
-
141
-
142
-
143
-
144
-
145
-
146
-
147
-
148
-
149
-
150
-
151
-
152
 |
 |

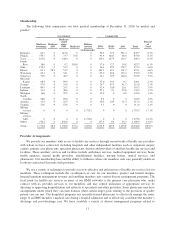
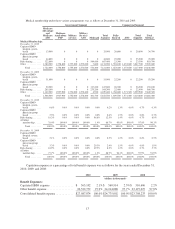
Medical membership under these various arrangements was as follows at December 31, 2010 and 2009:
Government Segment Commercial Segment
Medicare
Advantage
and
Medicare
ASO
Medicare
stand-alone
PDP
Military
services
Military
Services
ASO Medicaid
Total
Segment
Fully-
Insured ASO
Total
Segment
Total
Medical
Medical Membership:
December 31, 2010
Capitated HMO
hospital system
based .......... 13,900 0 0 0 0 13,900 20,800 0 20,800 34,700
Capitated HMO
physician group
based .......... 44,800 0 0 0 0 44,800 25,200 0 25,200 70,000
Risk-sharing ....... 322,800 0 0 0 564,600 887,400 23,300 0 23,300 910,700
Other ............ 1,380,500 1,758,800 1,755,200 1,272,600 7,800 6,174,900 1,594,100 1,453,600 3,047,700 9,222,600
Total ......... 1,762,000 1,758,800 1,755,200 1,272,600 572,400 7,121,000 1,663,400 1,453,600 3,117,000 10,238,000
December 31, 2009
Capitated HMO
hospital system
based .......... 31,000 0 0 0 0 31,000 22,200 0 22,200 53,200
Capitated HMO
physician group
based .......... 50,200 0 0 0 117,600 167,800 26,300 0 26,300 194,100
Risk-sharing ....... 285,100 0 0 0 279,200 564,300 22,400 0 22,400 586,700
Other ............ 1,142,200 1,927,900 1,756,000 1,278,400 4,900 6,109,400 1,768,600 1,571,300 3,339,900 9,449,300
Total ......... 1,508,500 1,927,900 1,756,000 1,278,400 401,700 6,872,500 1,839,500 1,571,300 3,410,800 10,283,300
December 31, 2010
Capitated HMO
hospital system
based .......... 0.8% 0.0% 0.0% 0.0% 0.0% 0.2% 1.3% 0.0% 0.7% 0.3%
Capitated HMO
physician group
based .......... 2.5% 0.0% 0.0% 0.0% 0.0% 0.6% 1.5% 0.0% 0.8% 0.7%
Risk-sharing ....... 18.3% 0.0% 0.0% 0.0% 98.6% 12.5% 1.4% 0.0% 0.7% 8.9%
All other
membership ..... 78.4% 100.0% 100.0% 100.0% 1.4% 86.7% 95.8% 100.0% 97.8% 90.1%
Total ......... 100.0% 100.0% 100.0% 100.0% 100.0% 100.0% 100.0% 100.0% 100.0% 100.0%
December 31, 2009
Capitated HMO
hospital system
based .......... 2.1% 0.0% 0.0% 0.0% 0.0% 0.5% 1.2% 0.0% 0.6% 0.5%
Capitated HMO
physician group
based .......... 3.3% 0.0% 0.0% 0.0% 29.3% 2.4% 1.5% 0.0% 0.8% 1.9%
Risk-sharing ....... 18.9% 0.0% 0.0% 0.0% 69.5% 8.2% 1.2% 0.0% 0.7% 5.7%
All other
membership ..... 75.7% 100.0% 100.0% 100.0% 1.2% 88.9% 96.1% 100.0% 97.9% 91.9%
Total ......... 100.0% 100.0% 100.0% 100.0% 100.0% 100.0% 100.0% 100.0% 100.0% 100.0%
Capitation expense as a percentage of total benefit expense was as follows for the years ended December 31,
2010, 2009, and 2008:
2010 2009 2008
(dollars in thousands)
Benefit Expenses:
Capitated HMO expense ............... $ 565,102 2.1% $ 560,914 2.3% $ 510,606 2.2%
Other benefit expense .................. 26,522,772 97.9% 24,214,088 97.7% 23,197,627 97.8%
Consolidated benefit expense ............ $27,087,874 100.0% $24,775,002 100.0% $23,708,233 100.0%
13