Humana 2010 Annual Report Download - page 50
Download and view the complete annual report
Please find page 50 of the 2010 Humana annual report below. You can navigate through the pages in the report by either clicking on the pages listed below, or by using the keyword search tool below to find specific information within the annual report.-
 1
1 -
2
-
3
-
4
-
5
-
6
-
7
-
8
-
9
-
10
-
11
-
12
-
13
-
14
-
15
-
16
-
17
-
18
-
19
-
20
-
21
-
22
-
23
-
24
-
25
-
26
-
27
-
28
-
29
-
30
-
31
-
32
-
33
-
34
-
35
-
36
-
37
-
38
-
39
-
 40
40 -
 41
41 -
 42
42 -
 43
43 -
 44
44 -
 45
45 -
 46
46 -
 47
47 -
 48
48 -
 49
49 -
 50
50 -
 51
51 -
 52
52 -
 53
53 -
 54
54 -
 55
55 -
 56
56 -
 57
57 -
 58
58 -
 59
59 -
 60
60 -
61
-
62
-
63
-
64
-
65
-
66
-
67
-
68
-
69
-
70
-
71
-
72
-
73
-
74
-
75
-
76
-
77
-
78
-
79
-
80
-
81
-
82
-
83
-
84
-
85
-
86
-
87
-
88
-
89
-
90
-
91
-
92
-
93
-
94
-
95
-
96
-
97
-
98
-
99
-
100
-
101
-
102
-
103
-
104
-
105
-
106
-
107
-
108
-
109
-
110
-
111
-
112
-
113
-
114
-
115
-
116
-
117
-
118
-
119
-
120
-
121
-
122
-
123
-
124
-
125
-
126
-
127
-
128
-
129
-
130
-
131
-
132
-
133
-
134
-
135
-
136
-
137
-
138
-
139
-
140
-
141
-
142
-
143
-
144
-
145
-
146
-
147
-
148
-
149
-
150
-
151
-
152
 |
 |
ITEM 7. MANAGEMENT’S DISCUSSION AND ANALYSIS OF FINANCIAL CONDITION AND
RESULTS OF OPERATIONS
Overview
Headquartered in Louisville, Kentucky, Humana is one of the nation’s largest publicly traded health and
supplemental benefits companies, based on our 2010 revenues of approximately $33.9 billion. We provide full-
service benefits and wellness solutions, offering a wide array of health, pharmacy and supplemental benefit
products for employer groups, government benefit programs, and individuals, as well as primary and workplace
care through our medical centers and worksite medical facilities. As of December 31, 2010, we had
approximately 10.2 million members in our medical benefit plans, as well as approximately 7.1 million members
in our specialty products.
We manage our business with two segments: Government and Commercial. The Government segment
consists of beneficiaries of government benefit programs, and includes three lines of business: Medicare,
Military, and Medicaid. The Commercial segment consists of members enrolled in our medical and specialty
products marketed to employer groups and individuals. When identifying our segments, we aggregated products
with similar economic characteristics. These characteristics include the nature of customer groups as well as
pricing, benefits, and underwriting requirements. These segment groupings are consistent with information used
by our Chief Executive Officer.
The results of each segment are measured by income before income taxes. We allocate all selling, general
and administrative expenses, investment and other revenue, interest expense, and goodwill, but no other assets or
liabilities, to our segments. Members served by our two segments often utilize the same provider networks, in
some instances enabling us to obtain more favorable contract terms with providers. Our segments also share
indirect overhead costs and assets. As a result, the profitability of each segment is interdependent.
Our results are impacted by many factors, but most notably are influenced by our ability to establish and
maintain a competitive and efficient cost structure and to accurately and consistently establish competitive
premium, ASO fee, and plan benefit levels that are commensurate with our benefit and administrative costs.
Benefit costs are subject to a high rate of inflation due to many forces, including new higher priced technologies
and medical procedures, new prescription drugs and therapies, an aging population, lifestyle challenges including
diet and smoking, the tort liability system, and government regulation.
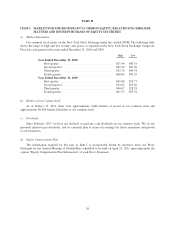
Our industry relies on two key statistics to measure performance. The benefit ratio, which is computed by
taking total benefit expenses as a percentage of premium revenues, represents a statistic used to measure
underwriting profitability. The selling, general, and administrative expense ratio, or SG&A expense ratio, which
is computed by taking total selling, general and administrative expenses as a percentage of premium revenues,
administrative services fees and other revenues, represents a statistic used to measure administrative spending
efficiency.
Health Insurance Reform
In March 2010, the President signed into law The Patient Protection and Affordable Care Act and The
Health Care and Education Reconciliation Act of 2010 (which we collectively refer to as the Health Insurance
Reform Legislation) which enact significant reforms to various aspects of the U.S. health insurance industry.
While regulations and interpretive guidance on some provisions of the Health Insurance Reform Legislation have
been issued to date by the Department of Health and Human Services (HHS), the Department of Labor, the
Treasury Department, and the National Association of Insurance Commissioners, there are many significant
provisions of the legislation that will require additional guidance and clarification in the form of regulations and
interpretations in order to fully understand the impacts of the legislation on our overall business, which we expect
to occur over the next several years.
40