Humana 2010 Annual Report Download - page 125
Download and view the complete annual report
Please find page 125 of the 2010 Humana annual report below. You can navigate through the pages in the report by either clicking on the pages listed below, or by using the keyword search tool below to find specific information within the annual report.-
 1
1 -
2
-
3
-
4
-
5
-
6
-
7
-
8
-
9
-
10
-
11
-
12
-
13
-
14
-
15
-
16
-
17
-
18
-
19
-
20
-
21
-
22
-
23
-
24
-
25
-
26
-
27
-
28
-
29
-
30
-
31
-
32
-
33
-
34
-
35
-
36
-
37
-
38
-
39
-
40
-
41
-
42
-
43
-
44
-
45
-
46
-
47
-
48
-
49
-
50
-
51
-
52
-
53
-
54
-
55
-
56
-
57
-
58
-
59
-
60
-
61
-
62
-
63
-
64
-
65
-
66
-
67
-
68
-
69
-
70
-
71
-
72
-
73
-
74
-
75
-
76
-
77
-
78
-
79
-
80
-
81
-
82
-
83
-
84
-
85
-
86
-
87
-
88
-
89
-
90
-
91
-
92
-
93
-
94
-
95
-
96
-
97
-
98
-
99
-
100
-
101
-
102
-
103
-
104
-
105
-
106
-
107
-
108
-
109
-
110
-
111
-
112
-
113
-
114
-
 115
115 -
 116
116 -
 117
117 -
 118
118 -
 119
119 -
 120
120 -
 121
121 -
 122
122 -
 123
123 -
 124
124 -
 125
125 -
 126
126 -
 127
127 -
 128
128 -
 129
129 -
 130
130 -
 131
131 -
 132
132 -
 133
133 -
 134
134 -
 135
135 -
136
-
137
-
138
-
139
-
140
-
141
-
142
-
143
-
144
-
145
-
146
-
147
-
148
-
149
-
150
-
151
-
152
 |
 |

Humana Inc.
NOTES TO CONSOLIDATED FINANCIAL STATEMENTS—(Continued)
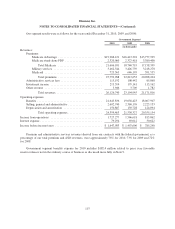
Our segment results were as follows for the years ended December 31, 2010, 2009, and 2008:
Government Segment
2010 2009 2008
(in thousands)
Revenues:
Premiums:
Medicare Advantage .............................. $19,286,121 $16,413,301 $13,777,999
Medicare stand-alone PDP ......................... 2,320,060 2,327,418 3,380,400
Total Medicare .............................. 21,606,181 18,740,719 17,158,399
Military services ................................. 3,462,544 3,426,739 3,218,270
Medicaid ....................................... 723,563 646,195 591,535
Total premiums .............................. 25,792,288 22,813,653 20,968,204
Administrative services fees ............................ 115,192 108,442 85,868
Investment income ................................... 213,314 179,141 115,162
Other revenue ....................................... 5,946 3,709 1,782
Total revenues ............................... 26,126,740 23,104,945 21,171,016
Operating expenses:
Benefits ............................................ 21,645,836 19,038,423 18,007,907
Selling, general and administrative ....................... 2,602,740 2,360,176 2,223,153
Depreciation and amortization .......................... 150,887 139,728 124,094
Total operating expenses ....................... 24,399,463 21,538,327 20,355,154
Income from operations ................................... 1,727,277 1,566,618 815,862
Interest expense .......................................... 79,294 69,012 30,622
Income before income taxes ................................ $ 1,647,983 $ 1,497,606 $ 785,240
Premium and administrative services revenues derived from our contracts with the federal government, as a
percentage of our total premium and ASO revenues, were approximately 76% for 2010, 73% for 2009 and 72%
for 2008.
Government segment benefits expense for 2010 includes $182.4 million related to prior year favorable
reserve releases not in the ordinary course of business as discussed more fully in Note 9.
115