Humana 2010 Annual Report Download - page 59
Download and view the complete annual report
Please find page 59 of the 2010 Humana annual report below. You can navigate through the pages in the report by either clicking on the pages listed below, or by using the keyword search tool below to find specific information within the annual report.-
 1
1 -
2
-
3
-
4
-
5
-
6
-
7
-
8
-
9
-
10
-
11
-
12
-
13
-
14
-
15
-
16
-
17
-
18
-
19
-
20
-
21
-
22
-
23
-
24
-
25
-
26
-
27
-
28
-
29
-
30
-
31
-
32
-
33
-
34
-
35
-
36
-
37
-
38
-
39
-
40
-
41
-
42
-
43
-
44
-
45
-
46
-
47
-
48
-
 49
49 -
 50
50 -
 51
51 -
 52
52 -
 53
53 -
 54
54 -
 55
55 -
 56
56 -
 57
57 -
 58
58 -
 59
59 -
 60
60 -
 61
61 -
 62
62 -
 63
63 -
 64
64 -
 65
65 -
 66
66 -
 67
67 -
 68
68 -
 69
69 -
70
-
71
-
72
-
73
-
74
-
75
-
76
-
77
-
78
-
79
-
80
-
81
-
82
-
83
-
84
-
85
-
86
-
87
-
88
-
89
-
90
-
91
-
92
-
93
-
94
-
95
-
96
-
97
-
98
-
99
-
100
-
101
-
102
-
103
-
104
-
105
-
106
-
107
-
108
-
109
-
110
-
111
-
112
-
113
-
114
-
115
-
116
-
117
-
118
-
119
-
120
-
121
-
122
-
123
-
124
-
125
-
126
-
127
-
128
-
129
-
130
-
131
-
132
-
133
-
134
-
135
-
136
-
137
-
138
-
139
-
140
-
141
-
142
-
143
-
144
-
145
-
146
-
147
-
148
-
149
-
150
-
151
-
152
 |
 |
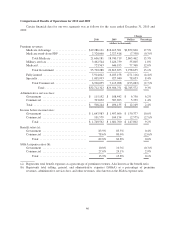
The consolidated benefit ratio for 2010 was 82.8% which was equivalent to the 2009 ratio.
The Government segment’s benefit expenses increased $2.6 billion, or 13.7%, in 2010 compared to 2009
primarily due to an increase in the average number of Medicare Advantage members. The Government
segment’s benefit ratio for 2010 was 83.9%, a 40 basis point increase from 83.5% for 2009, primarily driven by a
60 basis point increase in the Medicare benefit ratio. The increase in the benefit ratio resulted from growth in our
Medicare Advantage group business which generally carries a higher benefit ratio than our individual Medicare
Advantage business, partially offset by prior year favorable reserve releases not in the ordinary course of
business of an estimated $182.4 million in 2010. These favorable reserve releases decreased the Government
segment benefit ratio by approximately 70 basis points in 2010.
The Commercial segment’s benefit expenses decreased $294.5 million, or 5.1%, during 2010 compared to
2009. The decrease primarily was due to lower utilization, a decline in fully-insured membership, and prior year
favorable reserve releases not in the ordinary course of business of an estimated $48.8 million in 2010, partially
offset by a net charge of $138.9 million associated with reserve strengthening for our closed block of long-term
care policies in 2010. Fully-insured membership decreased 9.6%, or 176,100 members, to 1,663,400 at
December 31, 2010 compared to 1,839,500 at December 31, 2009 primarily due to continued pricing discipline.
The benefit ratio for the Commercial segment of 78.6% for 2010 decreased 200 basis points from the 2009
benefit ratio of 80.6%. The decrease primarily was due to medical trend that was lower than trend assumed in
pricing, continued pricing discipline, and prior year favorable reserve releases not in the ordinary course of
business in 2010, partially offset by reserve strengthening for our closed block of long-term care policies in 2010.
Medical trend was favorable, primarily affected by lower utilization of services as well as the use of services at
lower levels of intensity than prior year. The favorable reserve releases decreased the Commercial segment
benefit ratio by approximately 70 basis points in 2010 while the reserve strengthening for our closed block of
long-term care policies increased the Commercial segment benefit ratio by 200 basis points in 2010.
SG&A Expense
Consolidated SG&A expenses increased $435.3 million, or 10.3%, during 2010 compared to 2009,
primarily due to the $147.5 million write-down of deferred acquisition costs associated with our individual major
medical policies in 2010, increased Medicare investment spending for our 2011 offerings, and administrative
costs associated with servicing higher average Medicare Advantage membership, partially offset by a decrease in
the number of our employees as a result of our administrative cost reduction strategies, including planned
workforce reductions in 2010. Excluding employees added with the acquisition of Concentra on December 21,
2010, the number of employees decreased by 800 to 27,300 at December 31, 2010 from 28,100 at December 31,
2009, or 2.8%, as we aligned the size of our workforce with our membership.
The consolidated SG&A expense ratio for 2010 was 13.9%, increasing 10 basis points from 13.8% for 2009.
The increase primarily was due to an increase in the Commercial segment SG&A expense ratio, as described
below.
Our Government and Commercial segments incur both direct and shared indirect overhead SG&A expenses.
We allocate the indirect overhead expenses shared by the two segments primarily as a function of revenues. As a
result, the profitability of each segment is interdependent.
SG&A expenses in the Government segment increased $242.6 million, or 10.3%, during 2010 compared to
2009. The increase primarily was due to administrative costs associated with servicing higher average Medicare
Advantage membership as well as increased Medicare investment spending for our 2011 offerings. The
Government segment SG&A expense ratio decreased 30 basis points from 10.3% for 2009 to 10.0% for 2010,
primarily due to efficiency gains associated with servicing higher average Medicare Advantage membership as
well as our continued focus on administrative cost reductions.
49