Humana 2010 Annual Report Download - page 131
Download and view the complete annual report
Please find page 131 of the 2010 Humana annual report below. You can navigate through the pages in the report by either clicking on the pages listed below, or by using the keyword search tool below to find specific information within the annual report.-
 1
1 -
2
-
3
-
4
-
5
-
6
-
7
-
8
-
9
-
10
-
11
-
12
-
13
-
14
-
15
-
16
-
17
-
18
-
19
-
20
-
21
-
22
-
23
-
24
-
25
-
26
-
27
-
28
-
29
-
30
-
31
-
32
-
33
-
34
-
35
-
36
-
37
-
38
-
39
-
40
-
41
-
42
-
43
-
44
-
45
-
46
-
47
-
48
-
49
-
50
-
51
-
52
-
53
-
54
-
55
-
56
-
57
-
58
-
59
-
60
-
61
-
62
-
63
-
64
-
65
-
66
-
67
-
68
-
69
-
70
-
71
-
72
-
73
-
74
-
75
-
76
-
77
-
78
-
79
-
80
-
81
-
82
-
83
-
84
-
85
-
86
-
87
-
88
-
89
-
90
-
91
-
92
-
93
-
94
-
95
-
96
-
97
-
98
-
99
-
100
-
101
-
102
-
103
-
104
-
105
-
106
-
107
-
108
-
109
-
110
-
111
-
112
-
113
-
114
-
115
-
116
-
117
-
118
-
119
-
120
-
 121
121 -
 122
122 -
 123
123 -
 124
124 -
 125
125 -
 126
126 -
 127
127 -
 128
128 -
 129
129 -
 130
130 -
 131
131 -
 132
132 -
 133
133 -
 134
134 -
 135
135 -
 136
136 -
 137
137 -
 138
138 -
 139
139 -
 140
140 -
 141
141 -
142
-
143
-
144
-
145
-
146
-
147
-
148
-
149
-
150
-
151
-
152
 |
 |

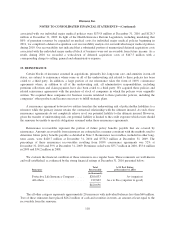
Humana Inc.
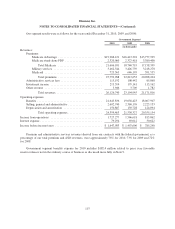
QUARTERLY FINANCIAL INFORMATION
(Unaudited)
A summary of our quarterly unaudited results of operations for the years ended December 31, 2010 and
2009 follows:
2010
First Second(1) Third Fourth(2)
(in thousands, except per share results)
Total revenues ................................... $8,440,594 $8,652,721 $8,424,648 $8,350,245
Income before income taxes ........................ 416,926 535,854 622,290 174,492
Net income ..................................... 258,768 340,076 393,221 107,325
Basic earnings per common share .................... 1.54 2.02 2.35 0.64
Diluted earnings per common share .................. 1.52 2.00 2.32 0.63
2009
First Second Third Fourth
(in thousands, except per share results)
Total revenues ................................... $7,711,661 $7,898,889 $7,716,819 $7,633,045
Income before income taxes ........................ 293,762 439,950 469,348 398,700
Net income ..................................... 205,717 281,780 301,519 250,659
Basic earnings per common share .................... 1.23 1.68 1.80 1.49
Diluted earnings per common share .................. 1.22 1.67 1.78 1.48
(1) Includes an expense of $147.5 million ($93.4 million after tax, or $0.55 per diluted common share) for the
write-down of deferred acquisition costs associated with our individual major medical policies as more fully
described in Note 18 to the consolidated financial statements.
(2) Includes an expense of $138.9 million ($88.0 million after tax, or $0.52 per diluted common share)
associated with reserve strengthening for our closed block of long-term care policies acquired in connection
with the 2007 acquisition of KMG America Corporation as more fully described in Note 18 to the
consolidated financial statements.
121