Humana 2010 Annual Report Download - page 48
Download and view the complete annual report
Please find page 48 of the 2010 Humana annual report below. You can navigate through the pages in the report by either clicking on the pages listed below, or by using the keyword search tool below to find specific information within the annual report.-
 1
1 -
2
-
3
-
4
-
5
-
6
-
7
-
8
-
9
-
10
-
11
-
12
-
13
-
14
-
15
-
16
-
17
-
18
-
19
-
20
-
21
-
22
-
23
-
24
-
25
-
26
-
27
-
28
-
29
-
30
-
31
-
32
-
33
-
34
-
35
-
36
-
37
-
 38
38 -
 39
39 -
 40
40 -
 41
41 -
 42
42 -
 43
43 -
 44
44 -
 45
45 -
 46
46 -
 47
47 -
 48
48 -
 49
49 -
 50
50 -
 51
51 -
 52
52 -
 53
53 -
 54
54 -
 55
55 -
 56
56 -
 57
57 -
 58
58 -
59
-
60
-
61
-
62
-
63
-
64
-
65
-
66
-
67
-
68
-
69
-
70
-
71
-
72
-
73
-
74
-
75
-
76
-
77
-
78
-
79
-
80
-
81
-
82
-
83
-
84
-
85
-
86
-
87
-
88
-
89
-
90
-
91
-
92
-
93
-
94
-
95
-
96
-
97
-
98
-
99
-
100
-
101
-
102
-
103
-
104
-
105
-
106
-
107
-
108
-
109
-
110
-
111
-
112
-
113
-
114
-
115
-
116
-
117
-
118
-
119
-
120
-
121
-
122
-
123
-
124
-
125
-
126
-
127
-
128
-
129
-
130
-
131
-
132
-
133
-
134
-
135
-
136
-
137
-
138
-
139
-
140
-
141
-
142
-
143
-
144
-
145
-
146
-
147
-
148
-
149
-
150
-
151
-
152
 |
 |

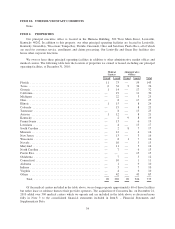
ITEM 6. SELECTED FINANCIAL DATA
2010 (a) 2009 2008 (b) 2007 (c) 2006 (d)
(in thousands, except per common share results, membership and
ratios)
Summary of Operations:
Revenues:
Premiums .................................... $32,712,323 $29,926,751 $28,064,844 $24,434,347 $20,729,182
Administrative services fees ...................... 508,244 496,135 451,879 391,515 341,211
Investment income ............................. 329,332 296,317 220,215 314,239 291,880
Other revenue ................................. 318,309 241,211 209,434 149,888 54,264
Total revenues ............................. 33,868,208 30,960,414 28,946,372 25,289,989 21,416,537
Operating expenses:
Benefits ...................................... 27,087,874 24,775,002 23,708,233 20,270,531 17,421,204
Selling, general and administrative ................. 4,662,802 4,227,535 3,944,652 3,476,468 3,021,509
Depreciation and amortization .................... 262,910 250,274 220,350 184,812 148,598
Total operating expenses ..................... 32,013,586 29,252,811 27,873,235 23,931,811 20,591,311
Income from operations ............................. 1,854,622 1,707,603 1,073,137 1,358,178 825,226
Interest expense .................................... 105,060 105,843 80,289 68,878 63,141
Income before income taxes .......................... 1,749,562 1,601,760 992,848 1,289,300 762,085
Provision for income taxes ........................... 650,172 562,085 345,694 455,616 274,662
Net income ....................................... $ 1,099,390 $ 1,039,675 $ 647,154 $ 833,684 $ 487,423
Basic earnings per common share ...................... $ 6.55 $ 6.21 $ 3.87 $ 5.00 $ 2.97
Diluted earnings per common share .................... $ 6.47 $ 6.15 $ 3.83 $ 4.91 $ 2.90
Financial Position:
Cash and investments ............................... $10,045,576 $ 9,110,738 $ 7,185,865 $ 6,690,820 $ 5,347,454
Total assets ....................................... 16,103,253 14,153,494 13,041,760 12,879,074 10,098,486
Benefits payable ................................... 3,469,306 3,222,574 3,205,579 2,696,833 2,410,407
Debt ............................................. 1,668,849 1,678,166 1,937,032 1,687,823 1,269,100
Stockholders’ equity ................................ 6,924,056 5,776,003 4,457,190 4,028,937 3,053,886
Key Financial Indicators:
Benefit ratio ...................................... 82.8% 82.8% 84.5% 83.0% 84.0 %
SG&A expense ratio ................................ 13.9% 13.8% 13.7% 13.9% 14.3 %
Medical Membership by Segment:
Government:
Medicare Advantage ............................ 1,733,800 1,508,500 1,435,900 1,143,000 1,002,600
Medicare Advantage ASO ....................... 28,2000000
Total Medicare Advantage ................... 1,762,000 1,508,500 1,435,900 1,143,000 1,002,600
Medicare stand-alone PDP ....................... 1,758,800 1,927,900 3,066,600 3,442,000 3,536,600
Total Medicare ............................ 3,520,800 3,436,400 4,502,500 4,585,000 4,539,200
Military services insured ......................... 1,755,200 1,756,000 1,736,400 1,719,100 1,716,400
Military services ASO ........................... 1,272,600 1,278,400 1,228,300 1,146,800 1,163,600
Total military services ....................... 3,027,800 3,034,400 2,964,700 2,865,900 2,880,000
Medicaid insured ............................... 572,400 401,700 385,400 384,400 390,700
Medicaid ASO ................................ 0 0 85,700 180,600 178,400
Total Medicaid ............................ 572,400 401,700 471,100 565,000 569,100
Total Government ...................... 7,121,000 6,872,500 7,938,300 8,015,900 7,988,300
Commercial:
Fully-insured .................................. 1,663,400 1,839,500 1,978,800 1,808,600 1,754,200
ASO ........................................ 1,453,600 1,571,300 1,642,000 1,643,000 1,529,600
Total Commercial .......................... 3,117,000 3,410,800 3,620,800 3,451,600 3,283,800
Total medical membership ................... 10,238,000 10,283,300 11,559,100 11,467,500 11,272,100
Specialty Membership:
Dental ....................................... 3,880,700 3,832,900 3,633,400 3,639,800 1,452,000
Vision ....................................... 2,186,400 2,369,400 2,141,600 2,272,800 0
Other supplemental benefits ...................... 1,009,000 907,600 846,800 731,200 450,800
Total specialty membership .................. 7,076,100 7,109,900 6,621,800 6,643,800 1,902,800
(a) Includes the acquired operations of Concentra Inc. from December 21, 2010. Also includes the benefit of $231.2 million ($146.5 million
after tax, or $0.86 per diluted common share) of prior year favorable reserve releases not in the ordinary course of business, as well as an
expense of $147.5 million ($93.4 million after tax, or $0.55 per diluted common share) for the write-down of deferred acquisition costs
associated with our individual major medical policies and an expense of $138.9 million ($88.0 million after tax, or $0.52 per diluted
common share) associated with reserve strengthening for our closed block of long-term care policies acquired in connection with the
2007 acquisition of KMG America Corporation.
38