Humana 2010 Annual Report Download - page 105
Download and view the complete annual report
Please find page 105 of the 2010 Humana annual report below. You can navigate through the pages in the report by either clicking on the pages listed below, or by using the keyword search tool below to find specific information within the annual report.-
 1
1 -
2
-
3
-
4
-
5
-
6
-
7
-
8
-
9
-
10
-
11
-
12
-
13
-
14
-
15
-
16
-
17
-
18
-
19
-
20
-
21
-
22
-
23
-
24
-
25
-
26
-
27
-
28
-
29
-
30
-
31
-
32
-
33
-
34
-
35
-
36
-
37
-
38
-
39
-
40
-
41
-
42
-
43
-
44
-
45
-
46
-
47
-
48
-
49
-
50
-
51
-
52
-
53
-
54
-
55
-
56
-
57
-
58
-
59
-
60
-
61
-
62
-
63
-
64
-
65
-
66
-
67
-
68
-
69
-
70
-
71
-
72
-
73
-
74
-
75
-
76
-
77
-
78
-
79
-
80
-
81
-
82
-
83
-
84
-
85
-
86
-
87
-
88
-
89
-
90
-
91
-
92
-
93
-
94
-
 95
95 -
 96
96 -
 97
97 -
 98
98 -
 99
99 -
 100
100 -
 101
101 -
 102
102 -
 103
103 -
 104
104 -
 105
105 -
 106
106 -
 107
107 -
 108
108 -
 109
109 -
 110
110 -
 111
111 -
 112
112 -
 113
113 -
 114
114 -
 115
115 -
116
-
117
-
118
-
119
-
120
-
121
-
122
-
123
-
124
-
125
-
126
-
127
-
128
-
129
-
130
-
131
-
132
-
133
-
134
-
135
-
136
-
137
-
138
-
139
-
140
-
141
-
142
-
143
-
144
-
145
-
146
-
147
-
148
-
149
-
150
-
151
-
152
 |
 |

Humana Inc.
NOTES TO CONSOLIDATED FINANCIAL STATEMENTS—(Continued)
municipal securities were pre-refunded, generally with U.S. government and agency securities, and 25% of our
tax-exempt securities were insured by bond insurers and had an equivalent S&P credit rating of AA exclusive of
the bond insurers’ guarantee. Our investment policy limits investments in a single issuer and requires
diversification among various asset types.
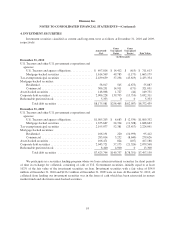
The recoverability of our residential and commercial mortgage-backed securities is supported by factors
such as seniority, underlying collateral characteristics and credit enhancements. Our residential and commercial
mortgage-backed securities at December 31, 2010 primarily were composed of senior tranches having high credit
support, with 99% of the collateral consisting of prime loans. All commercial mortgage-backed securities were
rated AA+ at December 31, 2010.
All issuers of securities we own that were trading at an unrealized loss at December 31, 2010 remain current
on all contractual payments. After taking into account these and other factors previously described, we believe
these unrealized losses primarily were caused by an increase in market interest rates and tighter liquidity
conditions in the current markets than when the securities were purchased. At December 31, 2010, we did not
intend to sell the securities with an unrealized loss position in accumulated other comprehensive income, and it is
not likely that we will be required to sell these securities before recovery of their amortized cost basis. As a
result, we believe that the securities with an unrealized loss were not other-than-temporarily impaired at
December 31, 2010.
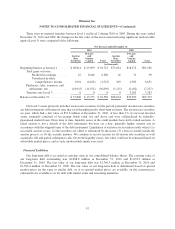
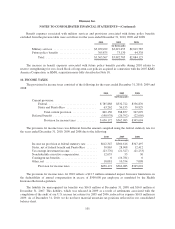
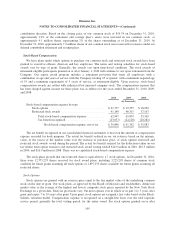
The detail of realized gains (losses) related to investment securities and included within investment income
was as follows for the years ended December 31, 2010, 2009, and 2008:
2010 2009 2008
(in thousands)
Gross realized gains .......................... $34,815 $ 123,361 $ 56,879
Gross realized losses ......................... (29,169) (103,878) (136,296)
Net realized capital gains (losses) ........... $ 5,646 $ 19,483 $ (79,417)
There were no material other-than-temporary impairments in 2010 or 2009. Gross realized losses in 2008
included other-than-temporary impairments of $103.1 million, primarily due to investments in Lehman Brothers
Holdings Inc. and certain of its subsidiaries, which filed for bankruptcy protection in 2008, as well as declines in
the values of securities primarily associated with the financial services industry.
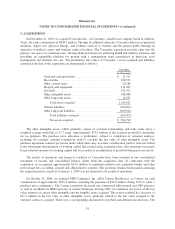
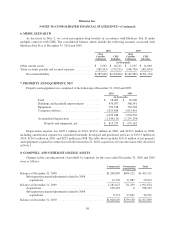
The contractual maturities of debt securities available for sale at December 31, 2010, regardless of their
balance sheet classification, are shown below. Expected maturities may differ from contractual maturities
because borrowers may have the right to call or prepay obligations with or without call or prepayment penalties.
Amortized
Cost
Fair
Value
(in thousands)
Due within one year .......................... $ 299,861 $ 301,630
Due after one year through five years ............. 1,936,215 1,991,966
Due after five years through ten years ............ 2,072,510 2,134,576
Due after ten years ............................ 1,740,450 1,754,419
Mortgage and asset-backed securities ............. 2,126,945 2,189,848
Total debt securities ...................... $8,175,981 $8,372,439
95