Humana 2010 Annual Report Download - page 110
Download and view the complete annual report
Please find page 110 of the 2010 Humana annual report below. You can navigate through the pages in the report by either clicking on the pages listed below, or by using the keyword search tool below to find specific information within the annual report.-
 1
1 -
2
-
3
-
4
-
5
-
6
-
7
-
8
-
9
-
10
-
11
-
12
-
13
-
14
-
15
-
16
-
17
-
18
-
19
-
20
-
21
-
22
-
23
-
24
-
25
-
26
-
27
-
28
-
29
-
30
-
31
-
32
-
33
-
34
-
35
-
36
-
37
-
38
-
39
-
40
-
41
-
42
-
43
-
44
-
45
-
46
-
47
-
48
-
49
-
50
-
51
-
52
-
53
-
54
-
55
-
56
-
57
-
58
-
59
-
60
-
61
-
62
-
63
-
64
-
65
-
66
-
67
-
68
-
69
-
70
-
71
-
72
-
73
-
74
-
75
-
76
-
77
-
78
-
79
-
80
-
81
-
82
-
83
-
84
-
85
-
86
-
87
-
88
-
89
-
90
-
91
-
92
-
93
-
94
-
95
-
96
-
97
-
98
-
99
-
 100
100 -
 101
101 -
 102
102 -
 103
103 -
 104
104 -
 105
105 -
 106
106 -
 107
107 -
 108
108 -
 109
109 -
 110
110 -
 111
111 -
 112
112 -
 113
113 -
 114
114 -
 115
115 -
 116
116 -
 117
117 -
 118
118 -
 119
119 -
 120
120 -
121
-
122
-
123
-
124
-
125
-
126
-
127
-
128
-
129
-
130
-
131
-
132
-
133
-
134
-
135
-
136
-
137
-
138
-
139
-
140
-
141
-
142
-
143
-
144
-
145
-
146
-
147
-
148
-
149
-
150
-
151
-
152
 |
 |

Humana Inc.
NOTES TO CONSOLIDATED FINANCIAL STATEMENTS—(Continued)
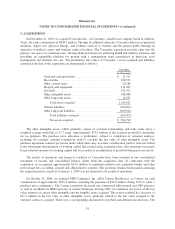
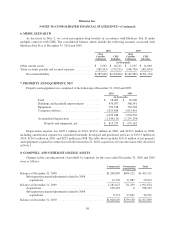
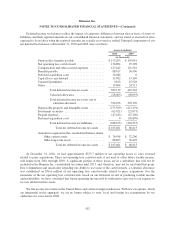
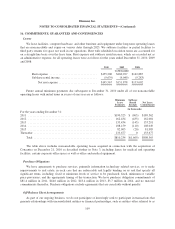
9. BENEFITS PAYABLE
Activity in benefits payable, excluding military services, was as follows for the years ended December 31,
2010, 2009 and 2008:
2010 2009 2008
(in thousands)
Balances at January 1 ................................... $ 2,943,379 $ 2,898,782 $ 2,355,461
Acquisitions ........................................... 0 0 96,021
Incurred related to:
Current year ....................................... 24,156,522 21,934,973 21,092,135
Prior years ........................................ (434,015) (252,756) (268,027)
Total incurred ................................. 23,722,507 21,682,217 20,824,108
Paid related to:
Current year ....................................... (21,642,150) (19,572,740) (18,579,247)
Prior years ........................................ (1,809,610) (2,064,880) (1,797,561)
Total paid ..................................... (23,451,760) (21,637,620) (20,376,808)
Balances at December 31 ................................ $ 3,214,126 $ 2,943,379 $ 2,898,782
Amounts incurred related to prior years vary from previously estimated liabilities as the claims ultimately
are settled. Negative amounts reported for incurred related to prior years result from claims being ultimately
settled for amounts less than originally estimated (favorable development).
Actuarial standards require the use of assumptions based on moderately adverse experience, which generally
results in favorable reserve development, or reserves that are considered redundant. The amount of redundancy
over the last three years primarily has been impacted by the growth in our Medicare business, coupled with the
application of consistent reserving practices. During 2010, we experienced prior year favorable reserve releases
not in the ordinary course of business of approximately $231.2 million. This favorable reserve development
primarily resulted from improvements in the claims processing environment and, to a lesser extent, better than
originally estimated utilization as well as a shortening of the cycle time associated with provider claim
submissions. The improvements in the claims processing environment benefited all lines of business, but were
most prominent in our Medicare PFFS line of business. These improvements resulted in recoveries from the
identification of claims billed at higher cost codes than those documented in the medical records via audits, as
well as an improved ability to collect overpayments due to the development of system enhancements to our
Commercial claims processing platform.
Military services benefits payable of $255.2 million and $279.2 million at December 31, 2010 and 2009,
respectively, primarily consisted of our estimate of incurred healthcare services provided to beneficiaries which
are in turn reimbursed by the federal government, as more fully described in Note 2. This amount is generally
offset by a corresponding receivable due from the federal government.
100