Humana 2010 Annual Report Download - page 87
Download and view the complete annual report
Please find page 87 of the 2010 Humana annual report below. You can navigate through the pages in the report by either clicking on the pages listed below, or by using the keyword search tool below to find specific information within the annual report.-
 1
1 -
2
-
3
-
4
-
5
-
6
-
7
-
8
-
9
-
10
-
11
-
12
-
13
-
14
-
15
-
16
-
17
-
18
-
19
-
20
-
21
-
22
-
23
-
24
-
25
-
26
-
27
-
28
-
29
-
30
-
31
-
32
-
33
-
34
-
35
-
36
-
37
-
38
-
39
-
40
-
41
-
42
-
43
-
44
-
45
-
46
-
47
-
48
-
49
-
50
-
51
-
52
-
53
-
54
-
55
-
56
-
57
-
58
-
59
-
60
-
61
-
62
-
63
-
64
-
65
-
66
-
67
-
68
-
69
-
70
-
71
-
72
-
73
-
74
-
75
-
76
-
 77
77 -
 78
78 -
 79
79 -
 80
80 -
 81
81 -
 82
82 -
 83
83 -
 84
84 -
 85
85 -
 86
86 -
 87
87 -
 88
88 -
 89
89 -
 90
90 -
 91
91 -
 92
92 -
 93
93 -
 94
94 -
 95
95 -
 96
96 -
 97
97 -
98
-
99
-
100
-
101
-
102
-
103
-
104
-
105
-
106
-
107
-
108
-
109
-
110
-
111
-
112
-
113
-
114
-
115
-
116
-
117
-
118
-
119
-
120
-
121
-
122
-
123
-
124
-
125
-
126
-
127
-
128
-
129
-
130
-
131
-
132
-
133
-
134
-
135
-
136
-
137
-
138
-
139
-
140
-
141
-
142
-
143
-
144
-
145
-
146
-
147
-
148
-
149
-
150
-
151
-
152
 |
 |

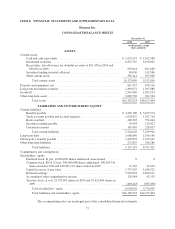
ITEM 8. FINANCIAL STATEMENTS AND SUPPLEMENTARY DATA
Humana Inc.
CONSOLIDATED BALANCE SHEETS
December 31,
2010 2009
(in thousands, except
share amounts)
ASSETS
Current assets:
Cash and cash equivalents .......................................... $ 1,673,137 $ 1,613,588
Investment securities .............................................. 6,872,767 6,190,062
Receivables, less allowance for doubtful accounts of $51,470 in 2010 and
$50,832 in 2009: ............................................... 959,018 823,620
Securities lending invested collateral ................................. 49,636 119,586
Other current assets ............................................... 583,141 505,960
Total current assets ........................................... 10,137,699 9,252,816
Property and equipment, net ............................................ 815,337 679,142
Long-term investment securities ......................................... 1,499,672 1,307,088
Goodwill ........................................................... 2,567,809 1,992,924
Other long-term assets ................................................. 1,082,736 921,524
Total assets ................................................. $16,103,253 $14,153,494
LIABILITIES AND STOCKHOLDERS’ EQUITY
Current liabilities:
Benefits payable ................................................. $ 3,469,306 $ 3,222,574
Trade accounts payable and accrued expenses .......................... 1,624,832 1,307,710
Book overdraft ................................................... 409,385 374,464
Securities lending payable .......................................... 55,693 126,427
Unearned revenues ............................................... 185,410 228,817
Total current liabilities ........................................ 5,744,626 5,259,992
Long-term debt ...................................................... 1,668,849 1,678,166
Future policy benefits payable .......................................... 1,492,855 1,193,047
Other long-term liabilities .............................................. 272,867 246,286
Total liabilities .............................................. 9,179,197 8,377,491
Commitments and contingencies
Stockholders’ equity:
Preferred stock, $1 par; 10,000,000 shares authorized; none issued ......... 0 0
Common stock, $0.16 2/3 par; 300,000,000 shares authorized; 190,244,741
shares issued in 2010 and 189,801,119 shares issued in 2009 ............ 31,707 31,634
Capital in excess of par value ....................................... 1,737,207 1,658,521
Retained earnings ................................................ 5,529,001 4,429,611
Accumulated other comprehensive income ............................ 120,584 42,135
Treasury stock, at cost, 21,795,051 shares in 2010 and 19,621,069 shares in
2009 ......................................................... (494,443) (385,898)
Total stockholders’ equity ...................................... 6,924,056 5,776,003
Total liabilities and stockholders’ equity .......................... $16,103,253 $14,153,494
The accompanying notes are an integral part of the consolidated financial statements.
77