Humana 2010 Annual Report Download - page 116
Download and view the complete annual report
Please find page 116 of the 2010 Humana annual report below. You can navigate through the pages in the report by either clicking on the pages listed below, or by using the keyword search tool below to find specific information within the annual report.-
 1
1 -
2
-
3
-
4
-
5
-
6
-
7
-
8
-
9
-
10
-
11
-
12
-
13
-
14
-
15
-
16
-
17
-
18
-
19
-
20
-
21
-
22
-
23
-
24
-
25
-
26
-
27
-
28
-
29
-
30
-
31
-
32
-
33
-
34
-
35
-
36
-
37
-
38
-
39
-
40
-
41
-
42
-
43
-
44
-
45
-
46
-
47
-
48
-
49
-
50
-
51
-
52
-
53
-
54
-
55
-
56
-
57
-
58
-
59
-
60
-
61
-
62
-
63
-
64
-
65
-
66
-
67
-
68
-
69
-
70
-
71
-
72
-
73
-
74
-
75
-
76
-
77
-
78
-
79
-
80
-
81
-
82
-
83
-
84
-
85
-
86
-
87
-
88
-
89
-
90
-
91
-
92
-
93
-
94
-
95
-
96
-
97
-
98
-
99
-
100
-
101
-
102
-
103
-
104
-
105
-
 106
106 -
 107
107 -
 108
108 -
 109
109 -
 110
110 -
 111
111 -
 112
112 -
 113
113 -
 114
114 -
 115
115 -
 116
116 -
 117
117 -
 118
118 -
 119
119 -
 120
120 -
 121
121 -
 122
122 -
 123
123 -
 124
124 -
 125
125 -
 126
126 -
127
-
128
-
129
-
130
-
131
-
132
-
133
-
134
-
135
-
136
-
137
-
138
-
139
-
140
-
141
-
142
-
143
-
144
-
145
-
146
-
147
-
148
-
149
-
150
-
151
-
152
 |
 |

Humana Inc.
NOTES TO CONSOLIDATED FINANCIAL STATEMENTS—(Continued)
January 1, 2010 to retirement eligible employees, the compensation expense is recognized on a straight-line basis
over the shorter of the requisite service period or the period from the date of grant to an employee’s eligible
retirement date.
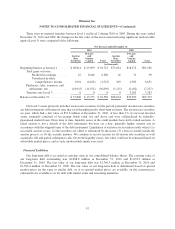
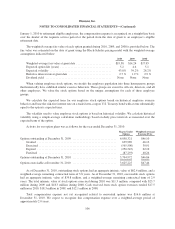
The weighted-average fair value of each option granted during 2010, 2009, and 2008 is provided below. The
fair value was estimated on the date of grant using the Black-Scholes pricing model with the weighted-average
assumptions indicated below:
2010 2009 2008
Weighted-average fair value at grant date ........................ $19.58 $14.24 $17.95
Expected option life (years) ................................... 5.2 4.6 5.1
Expected volatility .......................................... 43.8% 39.2% 28.2%
Risk-free interest rate at grant date ............................. 2.7% 1.9% 2.9%
Dividend yield ............................................. None None None
When valuing employee stock options, we stratify the employee population into three homogenous groups
that historically have exhibited similar exercise behaviors. These groups are executive officers, directors, and all
other employees. We value the stock options based on the unique assumptions for each of these employee
groups.
We calculate the expected term for our employee stock options based on historical employee exercise
behavior and base the risk-free interest rate on a traded zero-coupon U.S. Treasury bond with a term substantially
equal to the option’s expected term.
The volatility used to value employee stock options is based on historical volatility. We calculate historical
volatility using a simple-average calculation methodology based on daily price intervals as measured over the
expected term of the option.
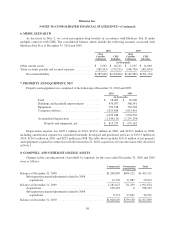
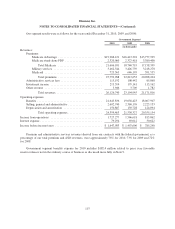
Activity for our option plans was as follows for the year ended December 31, 2010:
Shares Under
Option
Weighted-Average
Exercise Price
Options outstanding at December 31, 2009 .............................. 6,058,321 $46.10
Granted ...................................................... 639,989 46.12
Exercised ..................................................... (565,500) 30.91
Expired ...................................................... (250,545) 62.10
Forfeited ..................................................... (87,293) 48.24
Options outstanding at December 31, 2010 .............................. 5,794,972 $46.86
Options exercisable at December 31, 2010 .............................. 3,625,225 $47.46
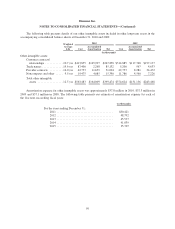
As of December 31, 2010, outstanding stock options had an aggregate intrinsic value of $62.4 million, and a
weighted-average remaining contractual term of 3.8 years. As of December 31, 2010, exercisable stock options
had an aggregate intrinsic value of $39.8 million, and a weighted-average remaining contractual term of 2.9
years. The total intrinsic value of stock options exercised during 2010 was $11.3 million, compared with $23.7
million during 2009 and $18.3 million during 2008. Cash received from stock option exercises totaled $17.5
million in 2010, $18.3 million in 2009, and $12.1 million in 2008.
Total compensation expense not yet recognized related to nonvested options was $16.6 million at
December 31, 2010. We expect to recognize this compensation expense over a weighted-average period of
approximately 2.0 years.
106