Humana 2010 Annual Report Download - page 60
Download and view the complete annual report
Please find page 60 of the 2010 Humana annual report below. You can navigate through the pages in the report by either clicking on the pages listed below, or by using the keyword search tool below to find specific information within the annual report.-
 1
1 -
2
-
3
-
4
-
5
-
6
-
7
-
8
-
9
-
10
-
11
-
12
-
13
-
14
-
15
-
16
-
17
-
18
-
19
-
20
-
21
-
22
-
23
-
24
-
25
-
26
-
27
-
28
-
29
-
30
-
31
-
32
-
33
-
34
-
35
-
36
-
37
-
38
-
39
-
40
-
41
-
42
-
43
-
44
-
45
-
46
-
47
-
48
-
49
-
 50
50 -
 51
51 -
 52
52 -
 53
53 -
 54
54 -
 55
55 -
 56
56 -
 57
57 -
 58
58 -
 59
59 -
 60
60 -
 61
61 -
 62
62 -
 63
63 -
 64
64 -
 65
65 -
 66
66 -
 67
67 -
 68
68 -
 69
69 -
 70
70 -
71
-
72
-
73
-
74
-
75
-
76
-
77
-
78
-
79
-
80
-
81
-
82
-
83
-
84
-
85
-
86
-
87
-
88
-
89
-
90
-
91
-
92
-
93
-
94
-
95
-
96
-
97
-
98
-
99
-
100
-
101
-
102
-
103
-
104
-
105
-
106
-
107
-
108
-
109
-
110
-
111
-
112
-
113
-
114
-
115
-
116
-
117
-
118
-
119
-
120
-
121
-
122
-
123
-
124
-
125
-
126
-
127
-
128
-
129
-
130
-
131
-
132
-
133
-
134
-
135
-
136
-
137
-
138
-
139
-
140
-
141
-
142
-
143
-
144
-
145
-
146
-
147
-
148
-
149
-
150
-
151
-
152
 |
 |
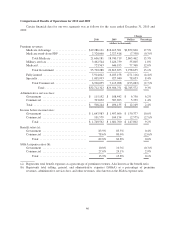
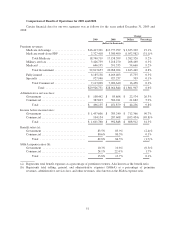
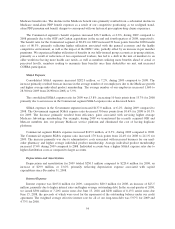
The Commercial segment SG&A expenses increased $192.7 million, or 10.3%, during 2010 compared to
2009. The Commercial segment SG&A expense ratio increased 290 basis points from 24.1% for 2009 to 27.0%
for 2010. The increase in SG&A expenses for 2010 primarily was due to a $147.5 million write-down of deferred
acquisition costs associated with our individual major medical policies which increased the SG&A expense ratio
190 basis points in 2010. In addition, the increases in 2010 primarily reflect administrative costs associated with
increased specialty and mail-order pharmacy business, partially offset by our continued focus on administrative
cost reductions.
Depreciation and Amortization
Depreciation and amortization for 2010 totaled $262.9 million compared to $250.3 million for 2009, an
increase of $12.6 million, or 5.0%, primarily reflecting depreciation expense associated with capital
expenditures.
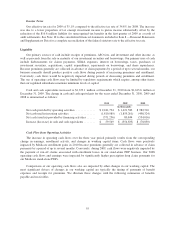
Interest Expense
Interest expense was $105.1 million for 2010, compared to $105.8 million for 2009, a decrease of $0.7
million, or 0.7%.
Income Taxes
Our effective tax rate during 2010 was 37.2% compared to the effective tax rate of 35.1% in 2009. The
increase from 2009 to 2010 primarily was due to the reduction of the $16.8 million liability for unrecognized tax
benefits as a result of audit settlements which reduced the effective income tax rate by 1.0% during 2009. In
addition, the tax rate for 2010 reflects the estimated impact of new limitations on the deductibility of annual
compensation in excess of $500,000 per employee as mandated by recent health insurance reforms. See Note 10
to the consolidated financial statements included in Item 8. – Financial Statements and Supplementary Data for a
complete reconciliation of the federal statutory rate to the effective tax rate. We expect the 2011 effective tax rate
to be approximately 37%.
50