Humana 2010 Annual Report Download - page 88
Download and view the complete annual report
Please find page 88 of the 2010 Humana annual report below. You can navigate through the pages in the report by either clicking on the pages listed below, or by using the keyword search tool below to find specific information within the annual report.-
 1
1 -
2
-
3
-
4
-
5
-
6
-
7
-
8
-
9
-
10
-
11
-
12
-
13
-
14
-
15
-
16
-
17
-
18
-
19
-
20
-
21
-
22
-
23
-
24
-
25
-
26
-
27
-
28
-
29
-
30
-
31
-
32
-
33
-
34
-
35
-
36
-
37
-
38
-
39
-
40
-
41
-
42
-
43
-
44
-
45
-
46
-
47
-
48
-
49
-
50
-
51
-
52
-
53
-
54
-
55
-
56
-
57
-
58
-
59
-
60
-
61
-
62
-
63
-
64
-
65
-
66
-
67
-
68
-
69
-
70
-
71
-
72
-
73
-
74
-
75
-
76
-
77
-
 78
78 -
 79
79 -
 80
80 -
 81
81 -
 82
82 -
 83
83 -
 84
84 -
 85
85 -
 86
86 -
 87
87 -
 88
88 -
 89
89 -
 90
90 -
 91
91 -
 92
92 -
 93
93 -
 94
94 -
 95
95 -
 96
96 -
 97
97 -
 98
98 -
99
-
100
-
101
-
102
-
103
-
104
-
105
-
106
-
107
-
108
-
109
-
110
-
111
-
112
-
113
-
114
-
115
-
116
-
117
-
118
-
119
-
120
-
121
-
122
-
123
-
124
-
125
-
126
-
127
-
128
-
129
-
130
-
131
-
132
-
133
-
134
-
135
-
136
-
137
-
138
-
139
-
140
-
141
-
142
-
143
-
144
-
145
-
146
-
147
-
148
-
149
-
150
-
151
-
152
 |
 |

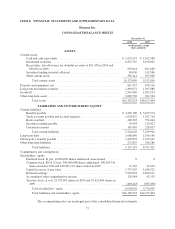
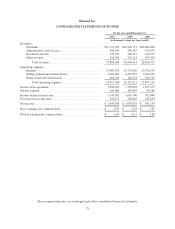
Humana Inc.
CONSOLIDATED STATEMENTS OF INCOME
For the year ended December 31,
2010 2009 2008
(in thousands, except per share results)
Revenues:
Premiums ........................................... $32,712,323 $29,926,751 $28,064,844
Administrative services fees ............................ 508,244 496,135 451,879
Investment income ................................... 329,332 296,317 220,215
Other revenue ....................................... 318,309 241,211 209,434
Total revenues ................................... 33,868,208 30,960,414 28,946,372
Operating expenses:
Benefits ............................................ 27,087,874 24,775,002 23,708,233
Selling, general and administrative ....................... 4,662,802 4,227,535 3,944,652
Depreciation and amortization .......................... 262,910 250,274 220,350
Total operating expenses ........................... 32,013,586 29,252,811 27,873,235
Income from operations ................................... 1,854,622 1,707,603 1,073,137
Interest expense .......................................... 105,060 105,843 80,289
Income before income taxes ................................ 1,749,562 1,601,760 992,848
Provision for income taxes ................................. 650,172 562,085 345,694
Net income ............................................. $ 1,099,390 $ 1,039,675 $ 647,154
Basic earnings per common share ............................ $ 6.55 $ 6.21 $ 3.87
Diluted earnings per common share .......................... $ 6.47 $ 6.15 $ 3.83
The accompanying notes are an integral part of the consolidated financial statements.
78