Humana 2010 Annual Report Download - page 99
Download and view the complete annual report
Please find page 99 of the 2010 Humana annual report below. You can navigate through the pages in the report by either clicking on the pages listed below, or by using the keyword search tool below to find specific information within the annual report.-
 1
1 -
2
-
3
-
4
-
5
-
6
-
7
-
8
-
9
-
10
-
11
-
12
-
13
-
14
-
15
-
16
-
17
-
18
-
19
-
20
-
21
-
22
-
23
-
24
-
25
-
26
-
27
-
28
-
29
-
30
-
31
-
32
-
33
-
34
-
35
-
36
-
37
-
38
-
39
-
40
-
41
-
42
-
43
-
44
-
45
-
46
-
47
-
48
-
49
-
50
-
51
-
52
-
53
-
54
-
55
-
56
-
57
-
58
-
59
-
60
-
61
-
62
-
63
-
64
-
65
-
66
-
67
-
68
-
69
-
70
-
71
-
72
-
73
-
74
-
75
-
76
-
77
-
78
-
79
-
80
-
81
-
82
-
83
-
84
-
85
-
86
-
87
-
88
-
 89
89 -
 90
90 -
 91
91 -
 92
92 -
 93
93 -
 94
94 -
 95
95 -
 96
96 -
 97
97 -
 98
98 -
 99
99 -
 100
100 -
 101
101 -
 102
102 -
 103
103 -
 104
104 -
 105
105 -
 106
106 -
 107
107 -
 108
108 -
 109
109 -
110
-
111
-
112
-
113
-
114
-
115
-
116
-
117
-
118
-
119
-
120
-
121
-
122
-
123
-
124
-
125
-
126
-
127
-
128
-
129
-
130
-
131
-
132
-
133
-
134
-
135
-
136
-
137
-
138
-
139
-
140
-
141
-
142
-
143
-
144
-
145
-
146
-
147
-
148
-
149
-
150
-
151
-
152
 |
 |
Humana Inc.
NOTES TO CONSOLIDATED FINANCIAL STATEMENTS—(Continued)
Derivative Financial Instruments
At times, we may use interest-rate swap agreements to manage our exposure to interest rate risk. The
differential between fixed and variable rates to be paid or received is accrued and recognized over the life of the
agreements as adjustments to interest expense in the consolidated statements of income. Our interest-rate swap
agreements convert the fixed interest rates on our senior notes to a variable rate and are accounted for as fair
value hedges. Our interest-rate swap agreements, terminated in 2008, are more fully described in Note 12.
Stock-Based Compensation
We recognize stock-based compensation expense, as determined on the date of grant at fair value, straight-
line over the period during which an employee is required to provide service in exchange for the award (usually
the vesting period). We estimate expected forfeitures and recognize compensation expense only for those awards
which are expected to vest. We estimate the grant-date fair value of stock options using the Black-Scholes
option- pricing model. In addition, we report certain tax effects of stock-based compensation as a financing
activity rather than an operating activity in the consolidated statement of cash flows. Additional detail regarding
our stock-based compensation plans is included in Note 13.
Earnings Per Common Share
We compute basic earnings per common share on the basis of the weighted-average number of unrestricted
common shares outstanding. Diluted earnings per common share is computed on the basis of the weighted-
average number of unrestricted common shares outstanding plus the dilutive effect of outstanding employee
stock options and restricted shares using the treasury stock method.
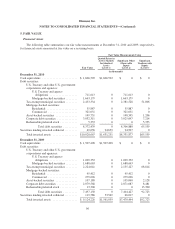
Fair Value
Assets and liabilities measured at fair value are categorized into a fair value hierarchy based on whether the
inputs to valuation techniques are observable or unobservable. Observable inputs reflect market data obtained
from independent sources, while unobservable inputs reflect our own assumptions about the assumptions market
participants would use. The fair value hierarchy includes three levels of inputs that may be used to measure fair
value as described below.
Level 1 – Quoted prices in active markets for identical assets or liabilities. Level 1 assets and liabilities
include debt and equity securities that are traded in an active exchange market.
Level 2 – Observable inputs other than Level 1 prices such as quoted prices in active markets for similar
assets or liabilities, quoted prices for identical or similar assets or liabilities in markets that are not active, or
other inputs that are observable or can be corroborated by observable market data for substantially the full
term of the assets or liabilities. Level 2 assets and liabilities include debt securities with quoted prices that
are traded less frequently than exchange-traded instruments as well as debt securities and derivative
contracts whose value is determined using a pricing model with inputs that are observable in the market or
can be derived principally from or corroborated by observable market data.
Level 3 – Unobservable inputs that are supported by little or no market activity and are significant to the fair
value of the assets or liabilities. Level 3 includes assets and liabilities whose value is determined using
pricing models, discounted cash flow methodologies, or similar techniques reflecting our own assumptions
about the assumptions market participants would use as well as those requiring significant management
judgment.
89