Humana 2010 Annual Report Download - page 61
Download and view the complete annual report
Please find page 61 of the 2010 Humana annual report below. You can navigate through the pages in the report by either clicking on the pages listed below, or by using the keyword search tool below to find specific information within the annual report.-
 1
1 -
2
-
3
-
4
-
5
-
6
-
7
-
8
-
9
-
10
-
11
-
12
-
13
-
14
-
15
-
16
-
17
-
18
-
19
-
20
-
21
-
22
-
23
-
24
-
25
-
26
-
27
-
28
-
29
-
30
-
31
-
32
-
33
-
34
-
35
-
36
-
37
-
38
-
39
-
40
-
41
-
42
-
43
-
44
-
45
-
46
-
47
-
48
-
49
-
50
-
 51
51 -
 52
52 -
 53
53 -
 54
54 -
 55
55 -
 56
56 -
 57
57 -
 58
58 -
 59
59 -
 60
60 -
 61
61 -
 62
62 -
 63
63 -
 64
64 -
 65
65 -
 66
66 -
 67
67 -
 68
68 -
 69
69 -
 70
70 -
 71
71 -
72
-
73
-
74
-
75
-
76
-
77
-
78
-
79
-
80
-
81
-
82
-
83
-
84
-
85
-
86
-
87
-
88
-
89
-
90
-
91
-
92
-
93
-
94
-
95
-
96
-
97
-
98
-
99
-
100
-
101
-
102
-
103
-
104
-
105
-
106
-
107
-
108
-
109
-
110
-
111
-
112
-
113
-
114
-
115
-
116
-
117
-
118
-
119
-
120
-
121
-
122
-
123
-
124
-
125
-
126
-
127
-
128
-
129
-
130
-
131
-
132
-
133
-
134
-
135
-
136
-
137
-
138
-
139
-
140
-
141
-
142
-
143
-
144
-
145
-
146
-
147
-
148
-
149
-
150
-
151
-
152
 |
 |

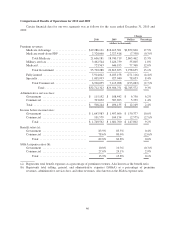
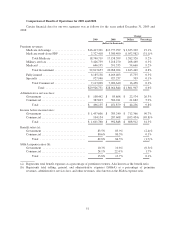
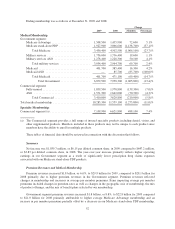
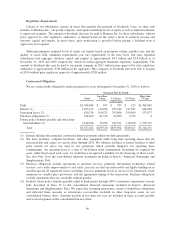
Comparison of Results of Operations for 2009 and 2008
Certain financial data for our two segments was as follows for the years ended December 31, 2009 and
2008:
Change
2009 2008 Dollars Percentage
(dollars in thousands)
Premium revenues:
Medicare Advantage ....................... $16,413,301 $13,777,999 $ 2,635,302 19.1%
Medicare stand-alone PDP .................. 2,327,418 3,380,400 (1,052,982) (31.1)%
Total Medicare ....................... 18,740,719 17,158,399 1,582,320 9.2%
Military services .......................... 3,426,739 3,218,270 208,469 6.5%
Medicaid ................................ 646,195 591,535 54,660 9.2%
Total Government ..................... 22,813,653 20,968,204 1,845,449 8.8%
Fully-insured ............................. 6,185,158 6,169,403 15,755 0.3%
Specialty ................................ 927,940 927,237 703 0.1%
Total Commercial ..................... 7,113,098 7,096,640 16,458 0.2%
Total ........................... $29,926,751 $28,064,844 $ 1,861,907 6.6%
Administrative services fees:
Government ............................. $ 108,442 $ 85,868 $ 22,574 26.3%
Commercial .............................. 387,693 366,011 21,682 5.9%
Total ............................... $ 496,135 $ 451,879 $ 44,256 9.8%
Income before income taxes:
Government ............................. $ 1,497,606 $ 785,240 $ 712,366 90.7%
Commercial .............................. 104,154 207,608 (103,454) (49.8)%
Total ............................... $ 1,601,760 $ 992,848 $ 608,912 61.3%
Benefit ratios (a):
Government ............................. 83.5% 85.9% (2.4)%
Commercial .............................. 80.6% 80.3% 0.3%
Total ............................... 82.8% 84.5% (1.7)%
SG&A expense ratios (b):
Government ............................. 10.3% 10.6% (0.3)%
Commercial .............................. 24.1% 22.4 % 1.7%
Total ............................... 13.8% 13.7% 0.1%
(a) Represents total benefit expenses as a percentage of premium revenues. Also known as the benefit ratio.
(b) Represents total selling, general, and administrative expenses (SG&A) as a percentage of premium
revenues, administrative services fees, and other revenues. Also known as the SG&A expense ratio.
51