Humana 2010 Annual Report Download - page 106
Download and view the complete annual report
Please find page 106 of the 2010 Humana annual report below. You can navigate through the pages in the report by either clicking on the pages listed below, or by using the keyword search tool below to find specific information within the annual report.-
 1
1 -
2
-
3
-
4
-
5
-
6
-
7
-
8
-
9
-
10
-
11
-
12
-
13
-
14
-
15
-
16
-
17
-
18
-
19
-
20
-
21
-
22
-
23
-
24
-
25
-
26
-
27
-
28
-
29
-
30
-
31
-
32
-
33
-
34
-
35
-
36
-
37
-
38
-
39
-
40
-
41
-
42
-
43
-
44
-
45
-
46
-
47
-
48
-
49
-
50
-
51
-
52
-
53
-
54
-
55
-
56
-
57
-
58
-
59
-
60
-
61
-
62
-
63
-
64
-
65
-
66
-
67
-
68
-
69
-
70
-
71
-
72
-
73
-
74
-
75
-
76
-
77
-
78
-
79
-
80
-
81
-
82
-
83
-
84
-
85
-
86
-
87
-
88
-
89
-
90
-
91
-
92
-
93
-
94
-
95
-
 96
96 -
 97
97 -
 98
98 -
 99
99 -
 100
100 -
 101
101 -
 102
102 -
 103
103 -
 104
104 -
 105
105 -
 106
106 -
 107
107 -
 108
108 -
 109
109 -
 110
110 -
 111
111 -
 112
112 -
 113
113 -
 114
114 -
 115
115 -
 116
116 -
117
-
118
-
119
-
120
-
121
-
122
-
123
-
124
-
125
-
126
-
127
-
128
-
129
-
130
-
131
-
132
-
133
-
134
-
135
-
136
-
137
-
138
-
139
-
140
-
141
-
142
-
143
-
144
-
145
-
146
-
147
-
148
-
149
-
150
-
151
-
152
 |
 |

Humana Inc.
NOTES TO CONSOLIDATED FINANCIAL STATEMENTS—(Continued)
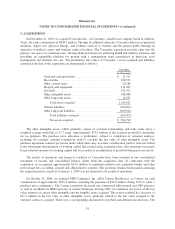
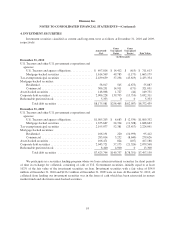
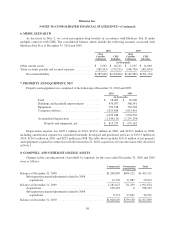
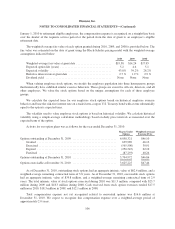
5. FAIR VALUE
Financial Assets
The following table summarizes our fair value measurements at December 31, 2010 and 2009, respectively,
for financial assets measured at fair value on a recurring basis:
Fair Value Measurements Using
Fair Value
Quoted Prices in
Active Markets
for Identical
Assets
(Level 1)
Significant Other
Observable
Inputs
(Level 2)
Significant
Unobservable
Inputs
(Level 3)
(in thousands)
December 31, 2010
Cash equivalents ........................ $ 1,606,592 $1,606,592 $ 0 $ 0
Debt securities:
U.S. Treasury and other U.S. government
corporations and agencies:
U.S. Treasury and agency
obligations ................... 711,613 0 711,613 0
Mortgage-backed securities ........ 1,663,179 0 1,663,179 0
Tax-exempt municipal securities ........ 2,433,334 0 2,381,528 51,806
Mortgage-backed securities:
Residential ..................... 55,887 0 55,887 0
Commercial .................... 321,031 0 321,031 0
Asset-backed securities ............... 149,751 0 148,545 1,206
Corporate debt securities .............. 3,032,311 0 3,025,097 7,214
Redeemable preferred stock ............ 5,333 0 0 5,333
Total debt securities .......... 8,372,439 0 8,306,880 65,559
Securities lending invested collateral ......... 49,636 24,639 24,997 0
Total invested assets ................. $10,028,667 $1,631,231 $8,331,877 $65,559
December 31, 2009
Cash equivalents ........................ $ 1,507,490 $1,507,490 $ 0 $ 0
Debt securities:
U.S. Treasury and other U.S. government
corporations and agencies:
U.S. Treasury and agency
obligations ................... 1,009,352 0 1,009,352 0
Mortgage-backed securities ........ 1,688,663 0 1,688,663 0
Tax-exempt municipal securities ........ 2,224,041 0 2,155,227 68,814
Mortgage-backed securities:
Residential ..................... 95,412 0 95,412 0
Commercial .................... 279,626 0 279,626 0
Asset-backed securities ............... 107,188 0 105,060 2,128
Corporate debt securities .............. 2,079,568 0 2,071,087 8,481
Redeemable preferred stock ............ 13,300 0 0 13,300
Total debt securities .......... 7,497,150 0 7,404,427 92,723
Securities lending invested collateral ......... 119,586 53,569 66,017 0
Total invested assets ................. $ 9,124,226 $1,561,059 $7,470,444 $92,723
96