Humana 2010 Annual Report Download - page 56
Download and view the complete annual report
Please find page 56 of the 2010 Humana annual report below. You can navigate through the pages in the report by either clicking on the pages listed below, or by using the keyword search tool below to find specific information within the annual report.-
 1
1 -
2
-
3
-
4
-
5
-
6
-
7
-
8
-
9
-
10
-
11
-
12
-
13
-
14
-
15
-
16
-
17
-
18
-
19
-
20
-
21
-
22
-
23
-
24
-
25
-
26
-
27
-
28
-
29
-
30
-
31
-
32
-
33
-
34
-
35
-
36
-
37
-
38
-
39
-
40
-
41
-
42
-
43
-
44
-
45
-
 46
46 -
 47
47 -
 48
48 -
 49
49 -
 50
50 -
 51
51 -
 52
52 -
 53
53 -
 54
54 -
 55
55 -
 56
56 -
 57
57 -
 58
58 -
 59
59 -
 60
60 -
 61
61 -
 62
62 -
 63
63 -
 64
64 -
 65
65 -
 66
66 -
67
-
68
-
69
-
70
-
71
-
72
-
73
-
74
-
75
-
76
-
77
-
78
-
79
-
80
-
81
-
82
-
83
-
84
-
85
-
86
-
87
-
88
-
89
-
90
-
91
-
92
-
93
-
94
-
95
-
96
-
97
-
98
-
99
-
100
-
101
-
102
-
103
-
104
-
105
-
106
-
107
-
108
-
109
-
110
-
111
-
112
-
113
-
114
-
115
-
116
-
117
-
118
-
119
-
120
-
121
-
122
-
123
-
124
-
125
-
126
-
127
-
128
-
129
-
130
-
131
-
132
-
133
-
134
-
135
-
136
-
137
-
138
-
139
-
140
-
141
-
142
-
143
-
144
-
145
-
146
-
147
-
148
-
149
-
150
-
151
-
152
 |
 |

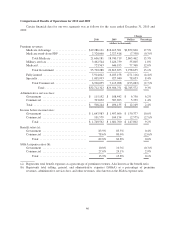
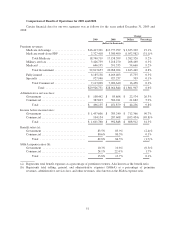
Comparison of Results of Operations for 2010 and 2009
Certain financial data for our two segments was as follows for the years ended December 31, 2010 and
2009:
Change
2010 2009 Dollars Percentage
(dollars in thousands)
Premium revenues:
Medicare Advantage ....................... $19,286,121 $16,413,301 $2,872,820 17.5%
Medicare stand-alone PDP ................... 2,320,060 2,327,418 (7,358) (0.3)%
Total Medicare ........................ 21,606,181 18,740,719 2,865,462 15.3%
Military services ........................... 3,462,544 3,426,739 35,805 1.0%
Medicaid ................................. 723,563 646,195 77,368 12.0%
Total Government ..................... 25,792,288 22,813,653 2,978,635 13.1%
Fully-insured ............................. 5,914,042 6,185,158 (271,116) (4.4)%
Specialty ................................. 1,005,993 927,940 78,053 8.4%
Total Commercial ...................... 6,920,035 7,113,098 (193,063) (2.7)%
Total ............................ $32,712,323 $29,926,751 $2,785,572 9.3%
Administrative services fees:
Government .............................. $ 115,192 $ 108,442 $ 6,750 6.2%
Commercial .............................. 393,052 387,693 5,359 1.4%
Total .................................... $ 508,244 $ 496,135 $ 12,109 2.4%
Income before income taxes:
Government .............................. $ 1,647,983 $ 1,497,606 $ 150,377 10.0%
Commercial .............................. 101,579 104,154 (2,575) (2.5)%
Total ................................ $ 1,749,562 $ 1,601,760 $ 147,802 9.2%
Benefit ratios (a):
Government .............................. 83.9% 83.5% 0.4%
Commercial .............................. 78.6% 80.6% (2.0)%
Total ................................ 82.8% 82.8% 0.0%
SG&A expense ratios (b):
Government .............................. 10.0% 10.3% (0.3)%
Commercial .............................. 27.0% 24.1% 2.9%
Total ................................ 13.9% 13.8% 0.1%
(a) Represents total benefit expenses as a percentage of premium revenues. Also known as the benefit ratio.
(b) Represents total selling, general, and administrative expenses (SG&A) as a percentage of premium
revenues, administrative services fees, and other revenues. Also known as the SG&A expense ratio.
46