Humana 2010 Annual Report Download - page 81
Download and view the complete annual report
Please find page 81 of the 2010 Humana annual report below. You can navigate through the pages in the report by either clicking on the pages listed below, or by using the keyword search tool below to find specific information within the annual report.-
 1
1 -
2
-
3
-
4
-
5
-
6
-
7
-
8
-
9
-
10
-
11
-
12
-
13
-
14
-
15
-
16
-
17
-
18
-
19
-
20
-
21
-
22
-
23
-
24
-
25
-
26
-
27
-
28
-
29
-
30
-
31
-
32
-
33
-
34
-
35
-
36
-
37
-
38
-
39
-
40
-
41
-
42
-
43
-
44
-
45
-
46
-
47
-
48
-
49
-
50
-
51
-
52
-
53
-
54
-
55
-
56
-
57
-
58
-
59
-
60
-
61
-
62
-
63
-
64
-
65
-
66
-
67
-
68
-
69
-
70
-
 71
71 -
 72
72 -
 73
73 -
 74
74 -
 75
75 -
 76
76 -
 77
77 -
 78
78 -
 79
79 -
 80
80 -
 81
81 -
 82
82 -
 83
83 -
 84
84 -
 85
85 -
 86
86 -
 87
87 -
 88
88 -
 89
89 -
 90
90 -
 91
91 -
92
-
93
-
94
-
95
-
96
-
97
-
98
-
99
-
100
-
101
-
102
-
103
-
104
-
105
-
106
-
107
-
108
-
109
-
110
-
111
-
112
-
113
-
114
-
115
-
116
-
117
-
118
-
119
-
120
-
121
-
122
-
123
-
124
-
125
-
126
-
127
-
128
-
129
-
130
-
131
-
132
-
133
-
134
-
135
-
136
-
137
-
138
-
139
-
140
-
141
-
142
-
143
-
144
-
145
-
146
-
147
-
148
-
149
-
150
-
151
-
152
 |
 |

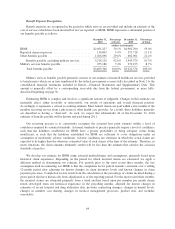
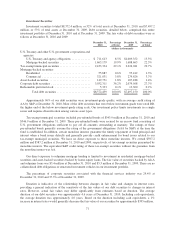
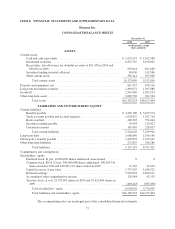
Investment Securities
Investment securities totaled $8,372.4 million, or 52% of total assets at December 31, 2010, and $7,497.2
million, or 53% of total assets at December 31, 2009. Debt securities, detailed below, comprised this entire
investment portfolio at December 31, 2010 and at December 31, 2009. The fair value of debt securities were as
follows at December 31, 2010 and 2009:
December 31,
2010
Percentage
of Total
December 31,
2009
Percentage
of Total
(dollars in thousands)
U.S. Treasury and other U.S. government corporations and
agencies:
U.S. Treasury and agency obligations ............. $ 711,613 8.5% $1,009,352 13.5%
Mortgage-backed securities ..................... 1,663,179 19.9% 1,688,663 22.5%
Tax-exempt municipal securities ..................... 2,433,334 29.1% 2,224,041 29.7%
Mortgage-backed securities:
Residential .................................. 55,887 0.6% 95,412 1.3%
Commercial ................................. 321,031 3.8% 279,626 3.7%
Asset-backed securities ............................ 149,751 1.8% 107,188 1.4%
Corporate debt securities ........................... 3,032,311 36.2% 2,079,568 27.7%
Redeemable preferred stock ........................ 5,333 0.1% 13,300 0.2%
Total debt securities ....................... $8,372,439 100.0% $7,497,150 100.0%
Approximately 96% of our debt securities were investment-grade quality, with an average credit rating of
AA by S&P at December 31, 2010. Most of the debt securities that were below investment-grade were rated BB,
the higher end of the below investment-grade rating scale. Our investment policy limits investments in a single
issuer and requires diversification among various asset types.
Tax-exempt municipal securities included pre-refunded bonds of $343.9 million at December 31, 2010 and
$346.9 million at December 31, 2009. These pre-refunded bonds were secured by an escrow fund consisting of
U.S. government obligations sufficient to pay off all amounts outstanding at maturity. The ratings of these
pre-refunded bonds generally assume the rating of the government obligations (AAA by S&P) at the time the
fund is established. In addition, certain monoline insurers guarantee the timely repayment of bond principal and
interest when a bond issuer defaults and generally provide credit enhancement for bond issues related to our
tax-exempt municipal securities. We have no direct exposure to these monoline insurers. We owned $597.2
million and $587.2 million at December 31, 2010 and 2009, respectively, of tax-exempt securities guaranteed by
monoline insurers. The equivalent S&P credit rating of these tax-exempt securities without the guarantee from
the monoline insurer was AA.
Our direct exposure to subprime mortgage lending is limited to investment in residential mortgage-backed
securities and asset-backed securities backed by home equity loans. The fair value of securities backed by Alt-A
and subprime loans was $3.4 million at December 31, 2010 and $5.5 million at December 31, 2009. There are no
collateralized debt obligations or structured investment vehicles in our investment portfolio.
The percentage of corporate securities associated with the financial services industry was 29.4% at
December 31, 2010 and 37.3% at December 31, 2009.
Duration is indicative of the relationship between changes in fair value and changes in interest rates,
providing a general indication of the sensitivity of the fair values of our debt securities to changes in interest
rates. However, actual fair values may differ significantly from estimates based on duration. The average
duration of our debt securities was approximately 4.6 years at December 31, 2010. Including cash equivalents,
the average duration was approximately 4.0 years. Based on the duration including cash equivalents, a 1%
increase in interest rates would generally decrease the fair value of our securities by approximately $395 million.
71