Humana 2010 Annual Report Download - page 144
Download and view the complete annual report
Please find page 144 of the 2010 Humana annual report below. You can navigate through the pages in the report by either clicking on the pages listed below, or by using the keyword search tool below to find specific information within the annual report.-
 1
1 -
2
-
3
-
4
-
5
-
6
-
7
-
8
-
9
-
10
-
11
-
12
-
13
-
14
-
15
-
16
-
17
-
18
-
19
-
20
-
21
-
22
-
23
-
24
-
25
-
26
-
27
-
28
-
29
-
30
-
31
-
32
-
33
-
34
-
35
-
36
-
37
-
38
-
39
-
40
-
41
-
42
-
43
-
44
-
45
-
46
-
47
-
48
-
49
-
50
-
51
-
52
-
53
-
54
-
55
-
56
-
57
-
58
-
59
-
60
-
61
-
62
-
63
-
64
-
65
-
66
-
67
-
68
-
69
-
70
-
71
-
72
-
73
-
74
-
75
-
76
-
77
-
78
-
79
-
80
-
81
-
82
-
83
-
84
-
85
-
86
-
87
-
88
-
89
-
90
-
91
-
92
-
93
-
94
-
95
-
96
-
97
-
98
-
99
-
100
-
101
-
102
-
103
-
104
-
105
-
106
-
107
-
108
-
109
-
110
-
111
-
112
-
113
-
114
-
115
-
116
-
117
-
118
-
119
-
120
-
121
-
122
-
123
-
124
-
125
-
126
-
127
-
128
-
129
-
130
-
131
-
132
-
133
-
 134
134 -
 135
135 -
 136
136 -
 137
137 -
 138
138 -
 139
139 -
 140
140 -
 141
141 -
 142
142 -
 143
143 -
 144
144 -
 145
145 -
 146
146 -
 147
147 -
 148
148 -
 149
149 -
 150
150 -
 151
151 -
 152
152
 |
 |

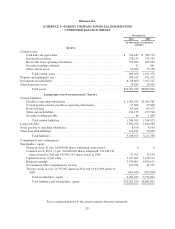
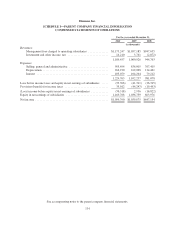
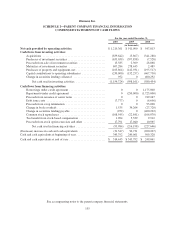
Humana Inc.
SCHEDULE I—PARENT COMPANY FINANCIAL INFORMATION
CONDENSED STATEMENTS OF OPERATIONS
For the year ended December 31,
2010 2009 2008
(in thousands)
Revenues:
Management fees charged to operating subsidiaries .............. $1,175,247 $1,057,185 $947,635
Investment and other income, net ............................ 14,210 3,741 (2,872)
1,189,457 1,060,926 944,763
Expenses:
Selling, general and administrative ........................... 955,494 836,005 767,405
Depreciation ............................................. 166,190 162,028 134,461
Interest ................................................. 103,079 104,204 79,212
1,224,763 1,102,237 981,078
Loss before income taxes and equity in net earnings of subsidiaries ..... (35,306) (41,311) (36,315)
Provision (benefit) for income taxes .............................. 35,012 (44,247) (19,493)
(Loss) income before equity in net earnings of subsidiaries ............ (70,318) 2,936 (16,822)
Equity in net earnings of subsidiaries ............................. 1,169,708 1,036,739 663,976
Net income .................................................. $1,099,390 $1,039,675 $647,154
See accompanying notes to the parent company financial statements.
134