Humana 2010 Annual Report Download - page 66
Download and view the complete annual report
Please find page 66 of the 2010 Humana annual report below. You can navigate through the pages in the report by either clicking on the pages listed below, or by using the keyword search tool below to find specific information within the annual report.-
 1
1 -
2
-
3
-
4
-
5
-
6
-
7
-
8
-
9
-
10
-
11
-
12
-
13
-
14
-
15
-
16
-
17
-
18
-
19
-
20
-
21
-
22
-
23
-
24
-
25
-
26
-
27
-
28
-
29
-
30
-
31
-
32
-
33
-
34
-
35
-
36
-
37
-
38
-
39
-
40
-
41
-
42
-
43
-
44
-
45
-
46
-
47
-
48
-
49
-
50
-
51
-
52
-
53
-
54
-
55
-
 56
56 -
 57
57 -
 58
58 -
 59
59 -
 60
60 -
 61
61 -
 62
62 -
 63
63 -
 64
64 -
 65
65 -
 66
66 -
 67
67 -
 68
68 -
 69
69 -
 70
70 -
 71
71 -
 72
72 -
 73
73 -
 74
74 -
 75
75 -
 76
76 -
77
-
78
-
79
-
80
-
81
-
82
-
83
-
84
-
85
-
86
-
87
-
88
-
89
-
90
-
91
-
92
-
93
-
94
-
95
-
96
-
97
-
98
-
99
-
100
-
101
-
102
-
103
-
104
-
105
-
106
-
107
-
108
-
109
-
110
-
111
-
112
-
113
-
114
-
115
-
116
-
117
-
118
-
119
-
120
-
121
-
122
-
123
-
124
-
125
-
126
-
127
-
128
-
129
-
130
-
131
-
132
-
133
-
134
-
135
-
136
-
137
-
138
-
139
-
140
-
141
-
142
-
143
-
144
-
145
-
146
-
147
-
148
-
149
-
150
-
151
-
152
 |
 |

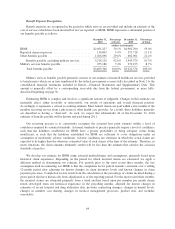
The detail of benefits payable was as follows at December 31, 2010, 2009 and 2008:
Change
2010 2009 2008 2010 2009
(in thousands)
IBNR (1) ........................... $2,051,227 $1,902,700 $1,851,047 $148,527 $51,653
Military services benefits payable (2) ..... 255,180 279,195 306,797 (24,015) (27,602)
Reported claims in process (3) ........... 136,803 357,718 486,514 (220,915) (128,796)
Other benefits payable (4) .............. 1,026,096 682,961 561,221 343,135 121,740
Total benefits payable ................. $3,469,306 $3,222,574 $3,205,579 $246,732 $16,995
(1) IBNR represents an estimate of benefits payable for claims incurred but not reported (IBNR) at the balance
sheet date. The level of IBNR is primarily impacted by membership levels, medical claim trends and the
receipt cycle time, which represents the length of time between when a claim is initially incurred and when
the claim form is received (i.e. a shorter time span results in a lower IBNR).
(2) Military services benefits payable primarily results from the timing of the cost of providing health care
services to beneficiaries and the payment to the provider. A corresponding receivable for reimbursement by
the federal government is included in the base receivable in the receivables table that follows.
(3) Reported claims in process represents the estimated valuation of processed claims that are in the post claim
adjudication process, which consists of administrative functions such as audit and check batching and
handling, as well as amounts owed to our pharmacy benefit administrator which fluctuate due to bi-weekly
payments and the month-end cutoff.
(4) Other benefits payable include amounts owed to providers under capitated and risk sharing arrangements.
The increase in benefits payable in 2010 and 2009 primarily was due to an increase in amounts owed to
providers under capitated and risk sharing arrangements as well as an increase in IBNR, both primarily as a result
of Medicare Advantage membership growth, partially offset by a decrease in the amount of processed but unpaid
claims, including pharmacy claims, which fluctuate due to the month-end cutoff. The increase in benefits payable
in 2008 primarily was due to the increase in IBNR from growth in Medicare Advantage members and, to a lesser
extent, benefit claims inflation, an increase in the amount of processed but unpaid claims, including pharmacy
claims, which fluctuate due to month-end cutoff, and an increase in amounts owed to providers under capitated
and risk sharing arrangements from Medicare Advantage membership growth.
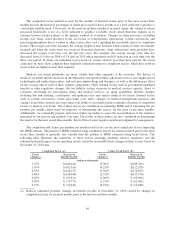
The detail of total net receivables was as follows at December 31, 2010, 2009 and 2008:
Change
2010 2009 2008 2010 2009
(in thousands)
Military services:
Base receivable ........................ $424,786 $451,248 $436,009 $(26,462) $15,239
Change orders ......................... 2,052 2,024 6,190 28 (4,166)
Military services subtotal ............ 426,838 453,272 442,199 (26,434) 11,073
Medicare ................................. 216,080 238,056 232,608 (21,976) 5,448
Commercial and other ....................... 367,570 183,124 164,035 184,446 19,089
Allowance for doubtful accounts .............. (51,470) (50,832) (49,160) (638) (1,672)
Total net receivables ............ $959,018 $823,620 $789,682 135,398 33,938
Reconciliation to cash flow statement:
Provision for doubtful accounts ........... 18,708 19,054
Receivables from acquisition ............. (108,571) 6,974
Change in receivables per cash flow statement
resulting in cash from operations ............ $45,535 $59,966
56