Humana 2010 Annual Report Download - page 117
Download and view the complete annual report
Please find page 117 of the 2010 Humana annual report below. You can navigate through the pages in the report by either clicking on the pages listed below, or by using the keyword search tool below to find specific information within the annual report.-
 1
1 -
2
-
3
-
4
-
5
-
6
-
7
-
8
-
9
-
10
-
11
-
12
-
13
-
14
-
15
-
16
-
17
-
18
-
19
-
20
-
21
-
22
-
23
-
24
-
25
-
26
-
27
-
28
-
29
-
30
-
31
-
32
-
33
-
34
-
35
-
36
-
37
-
38
-
39
-
40
-
41
-
42
-
43
-
44
-
45
-
46
-
47
-
48
-
49
-
50
-
51
-
52
-
53
-
54
-
55
-
56
-
57
-
58
-
59
-
60
-
61
-
62
-
63
-
64
-
65
-
66
-
67
-
68
-
69
-
70
-
71
-
72
-
73
-
74
-
75
-
76
-
77
-
78
-
79
-
80
-
81
-
82
-
83
-
84
-
85
-
86
-
87
-
88
-
89
-
90
-
91
-
92
-
93
-
94
-
95
-
96
-
97
-
98
-
99
-
100
-
101
-
102
-
103
-
104
-
105
-
106
-
 107
107 -
 108
108 -
 109
109 -
 110
110 -
 111
111 -
 112
112 -
 113
113 -
 114
114 -
 115
115 -
 116
116 -
 117
117 -
 118
118 -
 119
119 -
 120
120 -
 121
121 -
 122
122 -
 123
123 -
 124
124 -
 125
125 -
 126
126 -
 127
127 -
128
-
129
-
130
-
131
-
132
-
133
-
134
-
135
-
136
-
137
-
138
-
139
-
140
-
141
-
142
-
143
-
144
-
145
-
146
-
147
-
148
-
149
-
150
-
151
-
152
 |
 |

Humana Inc.
NOTES TO CONSOLIDATED FINANCIAL STATEMENTS—(Continued)
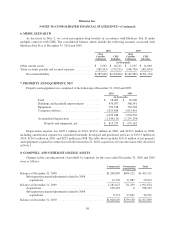
Restricted Stock Awards
Restricted stock awards, including both restricted stock and restricted stock units, are granted with a fair
value equal to the market price of our common stock on the date of grant. Compensation expense is recorded
straight-line over the vesting period, generally three years from the date of grant. For restricted stock awards
granted on or after January 1, 2010 to retirement eligible employees, the compensation expense is recognized on
a straight-line basis over the shorter of the vesting period or the period from the date of grant to an employee’s
eligible retirement date.
The weighted-average grant date fair value of our restricted stock awards was $49.29 in 2010, $41.16 in
2009, and $68.10 in 2008. Activity for our restricted stock awards was as follows for the year ended
December 31, 2010:
Shares
Weighted-
Average
Grant-Date
Fair Value
Nonvested restricted stock awards at December 31,
2009 ....................................... 2,345,555 $55.11
Granted .................................. 901,660 49.29
Vested ................................... (634,202) 62.18
Forfeited ................................. (150,154) 51.35
Expired .................................. (3,899) 59.66
Nonvested restricted stock awards at December 31,
2010 ....................................... 2,458,960 $51.38
The fair value of shares vested during the years ended was $30.0 million in 2010, $22.3 million in 2009, and
$28.7 million in 2008. Total compensation expense not yet recognized related to nonvested restricted stock
awards was $38.4 million at December 31, 2010. We expect to recognize this compensation expense over a
weighted-average period of approximately 2.0 years. There are no other contractual terms covering restricted
stock awards once vested.
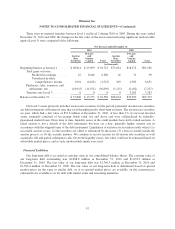
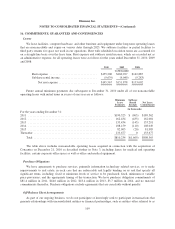
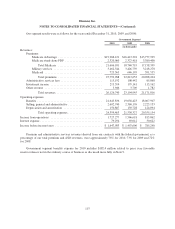
14. EARNINGS PER COMMON SHARE COMPUTATION
Detail supporting the computation of basic and diluted earnings per common share was as follows for the
years ended December 31, 2010, 2009 and 2008:
2010 2009 2008
(in thousands, except per share results)
Net income available for common stockholders ..................... $1,099,390 $1,039,675 $647,154
Weighted-average outstanding shares of common stock used to compute
basic earnings per common share .............................. 167,782 167,364 167,172
Dilutive effect of:
Employee stock options .................................... 676 677 1,173
Restricted stock awards .................................... 1,340 1,030 842
Shares used to compute diluted earnings per common share ............ 169,798 169,071 169,187
Basic earnings per common share ................................ $ 6.55 $ 6.21 $ 3.87
Diluted earnings per common share ............................... $ 6.47 $ 6.15 $ 3.83
107