Humana 2010 Annual Report Download - page 89
Download and view the complete annual report
Please find page 89 of the 2010 Humana annual report below. You can navigate through the pages in the report by either clicking on the pages listed below, or by using the keyword search tool below to find specific information within the annual report.-
 1
1 -
2
-
3
-
4
-
5
-
6
-
7
-
8
-
9
-
10
-
11
-
12
-
13
-
14
-
15
-
16
-
17
-
18
-
19
-
20
-
21
-
22
-
23
-
24
-
25
-
26
-
27
-
28
-
29
-
30
-
31
-
32
-
33
-
34
-
35
-
36
-
37
-
38
-
39
-
40
-
41
-
42
-
43
-
44
-
45
-
46
-
47
-
48
-
49
-
50
-
51
-
52
-
53
-
54
-
55
-
56
-
57
-
58
-
59
-
60
-
61
-
62
-
63
-
64
-
65
-
66
-
67
-
68
-
69
-
70
-
71
-
72
-
73
-
74
-
75
-
76
-
77
-
78
-
 79
79 -
 80
80 -
 81
81 -
 82
82 -
 83
83 -
 84
84 -
 85
85 -
 86
86 -
 87
87 -
 88
88 -
 89
89 -
 90
90 -
 91
91 -
 92
92 -
 93
93 -
 94
94 -
 95
95 -
 96
96 -
 97
97 -
 98
98 -
 99
99 -
100
-
101
-
102
-
103
-
104
-
105
-
106
-
107
-
108
-
109
-
110
-
111
-
112
-
113
-
114
-
115
-
116
-
117
-
118
-
119
-
120
-
121
-
122
-
123
-
124
-
125
-
126
-
127
-
128
-
129
-
130
-
131
-
132
-
133
-
134
-
135
-
136
-
137
-
138
-
139
-
140
-
141
-
142
-
143
-
144
-
145
-
146
-
147
-
148
-
149
-
150
-
151
-
152
 |
 |

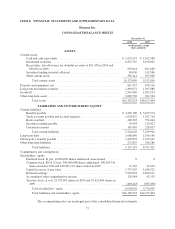
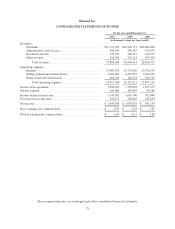
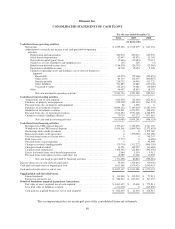
Humana Inc.
CONSOLIDATED STATEMENTS OF STOCKHOLDERS’ EQUITY
Capital In
Excess of
Par Value
Retained
Earnings
Accumulated
Other
Comprehensive
Income (Loss)
Treasury
Stock
Total
Stockholders’
Equity
Common Stock
Issued
Shares Amount
(in thousands)
Balances, January 1, 2008 ....................... 186,739 $31,123 $1,497,998 $2,742,782 $ 14,021 $(256,987) $4,028,937
Comprehensive income: ........................
Net income ................................ 647,154 647,154
Other comprehensive loss: ....................
Net unrealized investment losses, net of tax
benefit of $136,967 ...................... (239,591) (239,591)
Reclassification adjustment for net realized losses
included in net income, net of tax benefit of
$29,090 ............................... 50,327 50,327
Comprehensive income ..................... 457,890
Common stock repurchases ..................... (106,070) (106,070)
Stock-based compensation ...................... 55,369 55,369
Restricted stock grants ......................... 667 111 111
Restricted stock forfeitures ...................... (83) (14) 12 (2)
Stock option exercises .......................... 534 89 11,331 11,420
Stock option and restricted stock tax benefit ........ 9,535 9,535
Balances, December 31, 2008 .................... 187,857 31,309 1,574,245 3,389,936 (175,243) (363,057) 4,457,190
Comprehensive income:
Net income ................................ 1,039,675 1,039,675
Other comprehensive income: .................
Net unrealized investment gains, net of tax
expense of $131,229 ..................... 229,724 229,724
Reclassification adjustment for net realized gains
included in net income, net of tax expense of
$7,137 ................................ (12,346) (12,346)
Comprehensive income ..................... 1,257,053
Common stock repurchases ..................... (22,841) (22,841)
Stock-based compensation ...................... 65,870 65,870
Restricted stock grants ......................... 978 163 163
Restricted stock forfeitures ...................... (87) (14) 14 0
Stock option exercises .......................... 1,053 176 18,173 18,349
Stock option and restricted stock tax benefit ........ 219 219
Balances, December 31, 2009 .................... 189,801 31,634 1,658,521 4,429,611 42,135 (385,898) 5,776,003
Comprehensive income:
Net income ................................ 1,099,390 1,099,390
Other comprehensive income: .................
Net unrealized investment gains, net of tax
expense of $47,383 ...................... 82,026 82,026
Reclassification adjustment for net realized gains
included in net income, net of tax expense of
$2,069 ................................ (3,577) (3,577)
Comprehensive income ..................... 1,177,839
Common stock repurchases ..................... (108,545) (108,545)
Stock-based compensation ...................... 62,947 62,947
Restricted stock grants and restricted stock unit
vesting .................................... 5 0 0
Restricted stock forfeitures ...................... (127) (21) 21 0
Stock option exercises .......................... 566 94 17,384 17,478
Stock option and restricted stock tax benefit ........ (1,666) (1,666)
Balances, December 31, 2010 .................... 190,245 $31,707 $1,737,207 $5,529,001 $120,584 $(494,443) $6,924,056
The accompanying notes are an integral part of the consolidated financial statements.
79