Humana 2010 Annual Report Download - page 109
Download and view the complete annual report
Please find page 109 of the 2010 Humana annual report below. You can navigate through the pages in the report by either clicking on the pages listed below, or by using the keyword search tool below to find specific information within the annual report.-
 1
1 -
2
-
3
-
4
-
5
-
6
-
7
-
8
-
9
-
10
-
11
-
12
-
13
-
14
-
15
-
16
-
17
-
18
-
19
-
20
-
21
-
22
-
23
-
24
-
25
-
26
-
27
-
28
-
29
-
30
-
31
-
32
-
33
-
34
-
35
-
36
-
37
-
38
-
39
-
40
-
41
-
42
-
43
-
44
-
45
-
46
-
47
-
48
-
49
-
50
-
51
-
52
-
53
-
54
-
55
-
56
-
57
-
58
-
59
-
60
-
61
-
62
-
63
-
64
-
65
-
66
-
67
-
68
-
69
-
70
-
71
-
72
-
73
-
74
-
75
-
76
-
77
-
78
-
79
-
80
-
81
-
82
-
83
-
84
-
85
-
86
-
87
-
88
-
89
-
90
-
91
-
92
-
93
-
94
-
95
-
96
-
97
-
98
-
 99
99 -
 100
100 -
 101
101 -
 102
102 -
 103
103 -
 104
104 -
 105
105 -
 106
106 -
 107
107 -
 108
108 -
 109
109 -
 110
110 -
 111
111 -
 112
112 -
 113
113 -
 114
114 -
 115
115 -
 116
116 -
 117
117 -
 118
118 -
 119
119 -
120
-
121
-
122
-
123
-
124
-
125
-
126
-
127
-
128
-
129
-
130
-
131
-
132
-
133
-
134
-
135
-
136
-
137
-
138
-
139
-
140
-
141
-
142
-
143
-
144
-
145
-
146
-
147
-
148
-
149
-
150
-
151
-
152
 |
 |

Humana Inc.
NOTES TO CONSOLIDATED FINANCIAL STATEMENTS—(Continued)
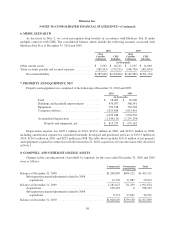
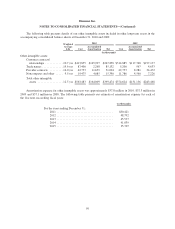
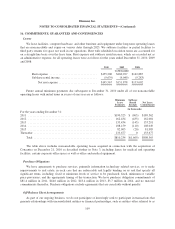
The following table presents details of our other intangible assets included in other long-term assets in the
accompanying consolidated balance sheets at December 31, 2010 and 2009:
Weighted
Average
Life
2010 2009
Cost
Accumulated
Amortization Net Cost
Accumulated
Amortization Net
(in thousands)
Other intangible assets:
Customer contracts/
relationships ............10.7 yrs $413,855 $145,997 $267,858 $314,885 $117,748 $197,137
Trade names ..............19.6 yrs 87,400 2,268 85,132 5,200 567 4,633
Provider contracts .........16.0 yrs 42,753 11,659 31,094 42,753 8,281 34,472
Noncompetes and other ..... 9.5yrs 19,475 4,085 15,390 11,786 4,560 7,226
Total other intangible
assets .................12.5 yrs $563,483 $164,009 $399,474 $374,624 $131,156 $243,468
Amortization expense for other intangible assets was approximately $37.8 million in 2010, $37.3 million in
2009 and $37.1 million in 2008. The following table presents our estimate of amortization expense for each of
the five next succeeding fiscal years:
(in thousands)
For the years ending December 31,:
2011 ...................................... $50,421
2012 ...................................... 48,792
2013 ...................................... 45,537
2014 ...................................... 41,039
2015 ...................................... 35,707
99