Humana 2010 Annual Report Download - page 76
Download and view the complete annual report
Please find page 76 of the 2010 Humana annual report below. You can navigate through the pages in the report by either clicking on the pages listed below, or by using the keyword search tool below to find specific information within the annual report.-
 1
1 -
2
-
3
-
4
-
5
-
6
-
7
-
8
-
9
-
10
-
11
-
12
-
13
-
14
-
15
-
16
-
17
-
18
-
19
-
20
-
21
-
22
-
23
-
24
-
25
-
26
-
27
-
28
-
29
-
30
-
31
-
32
-
33
-
34
-
35
-
36
-
37
-
38
-
39
-
40
-
41
-
42
-
43
-
44
-
45
-
46
-
47
-
48
-
49
-
50
-
51
-
52
-
53
-
54
-
55
-
56
-
57
-
58
-
59
-
60
-
61
-
62
-
63
-
64
-
65
-
 66
66 -
 67
67 -
 68
68 -
 69
69 -
 70
70 -
 71
71 -
 72
72 -
 73
73 -
 74
74 -
 75
75 -
 76
76 -
 77
77 -
 78
78 -
 79
79 -
 80
80 -
 81
81 -
 82
82 -
 83
83 -
 84
84 -
 85
85 -
 86
86 -
87
-
88
-
89
-
90
-
91
-
92
-
93
-
94
-
95
-
96
-
97
-
98
-
99
-
100
-
101
-
102
-
103
-
104
-
105
-
106
-
107
-
108
-
109
-
110
-
111
-
112
-
113
-
114
-
115
-
116
-
117
-
118
-
119
-
120
-
121
-
122
-
123
-
124
-
125
-
126
-
127
-
128
-
129
-
130
-
131
-
132
-
133
-
134
-
135
-
136
-
137
-
138
-
139
-
140
-
141
-
142
-
143
-
144
-
145
-
146
-
147
-
148
-
149
-
150
-
151
-
152
 |
 |

(b) Reflects estimated potential changes in benefits payable at December 31, 2010 caused by changes in
annualized claims trend used for the estimation of per member per month incurred claims for the most
recent three months.
(c) The factor change indicated represents the percentage point change.
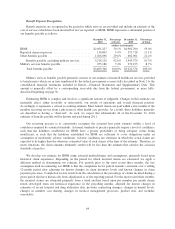
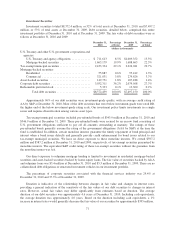
The following table provides a historical perspective regarding the accrual and payment of our benefits
payable, excluding military services. Components of the total incurred claims for each year include amounts
accrued for current year estimated benefit expenses as well as adjustments to prior year estimated accruals.
2010 2009 2008
(in thousands)
Balances at January 1 ................................... $ 2,943,379 $ 2,898,782 $ 2,355,461
Acquisitions ........................................... 0 0 96,021
Incurred related to: .....................................
Current year ....................................... 24,156,522 21,934,973 21,092,135
Prior years ........................................ (434,015) (252,756) (268,027)
Total incurred ................................. 23,722,507 21,682,217 20,824,108
Paid related to:
Current year ....................................... (21,642,150) (19,572,740) (18,579,247)
Prior years ........................................ (1,809,610) (2,064,880) (1,797,561)
Total paid ..................................... (23,451,760) (21,637,620) (20,376,808)
Balances at December 31 ................................ $ 3,214,126 $ 2,943,379 $ 2,898,782
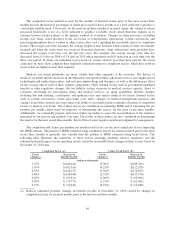
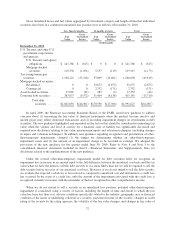
The following table summarizes the changes in estimate for incurred claims related to prior years
attributable to our key assumptions. As previously described, our key assumptions consist of trend and
completion factors estimated using an assumption of moderately adverse conditions. The amounts below
represent the difference between our original estimates and the actual benefit expenses ultimately incurred as
determined from subsequent claim payments.
Favorable Development by Changes in Key Assumptions
2010 2009 2008
Amount
Factor
Change (a) Amount
Factor
Change (a) Amount
Factor
Change (a)
(dollars in thousands)
Completion factors .......... $(220,653) 1.6% $(101,585) 0.8% $ (92,759) 1.0%
Trend factors ............... (213,362) (4.7)% (151,171) (3.5)% (175,268) (5.2)%
Total ................. $(434,015) $(252,756) $(268,027)
(a) The factor change indicated represents the percentage point change.
As previously discussed, our reserving practice is to consistently recognize the actuarial best estimate of our
ultimate liability for claims. Actuarial standards require the use of assumptions based on moderately adverse
experience, which generally results in favorable reserve development, or reserves that are considered redundant.
The amount of redundancy over the last three years primarily has been impacted by the growth in our Medicare
business, coupled with the application of consistent reserving practices. When we recognize a release of the
redundancy, we disclose the amount that is not in the ordinary course of business, if material. During 2010, we
experienced prior year favorable reserve releases not in the ordinary course of business of approximately $231.2
million. This favorable reserve development primarily resulted from improvements in the claims processing
environment and, to a lesser extent, better than originally estimated utilization as well as a shortening of the cycle
time associated with provider claim submissions. The improvements in the claims processing environment
benefited all lines of business, but were most prominent in our Medicare PFFS line of business. These
66