Humana 2010 Annual Report Download - page 57
Download and view the complete annual report
Please find page 57 of the 2010 Humana annual report below. You can navigate through the pages in the report by either clicking on the pages listed below, or by using the keyword search tool below to find specific information within the annual report.-
 1
1 -
2
-
3
-
4
-
5
-
6
-
7
-
8
-
9
-
10
-
11
-
12
-
13
-
14
-
15
-
16
-
17
-
18
-
19
-
20
-
21
-
22
-
23
-
24
-
25
-
26
-
27
-
28
-
29
-
30
-
31
-
32
-
33
-
34
-
35
-
36
-
37
-
38
-
39
-
40
-
41
-
42
-
43
-
44
-
45
-
46
-
 47
47 -
 48
48 -
 49
49 -
 50
50 -
 51
51 -
 52
52 -
 53
53 -
 54
54 -
 55
55 -
 56
56 -
 57
57 -
 58
58 -
 59
59 -
 60
60 -
 61
61 -
 62
62 -
 63
63 -
 64
64 -
 65
65 -
 66
66 -
 67
67 -
68
-
69
-
70
-
71
-
72
-
73
-
74
-
75
-
76
-
77
-
78
-
79
-
80
-
81
-
82
-
83
-
84
-
85
-
86
-
87
-
88
-
89
-
90
-
91
-
92
-
93
-
94
-
95
-
96
-
97
-
98
-
99
-
100
-
101
-
102
-
103
-
104
-
105
-
106
-
107
-
108
-
109
-
110
-
111
-
112
-
113
-
114
-
115
-
116
-
117
-
118
-
119
-
120
-
121
-
122
-
123
-
124
-
125
-
126
-
127
-
128
-
129
-
130
-
131
-
132
-
133
-
134
-
135
-
136
-
137
-
138
-
139
-
140
-
141
-
142
-
143
-
144
-
145
-
146
-
147
-
148
-
149
-
150
-
151
-
152
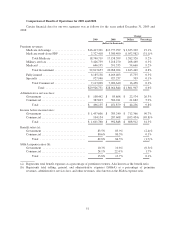
 |
 |

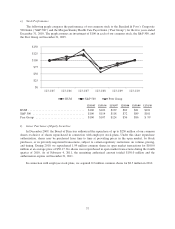
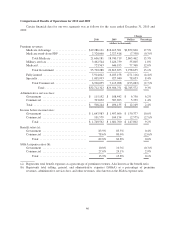
Ending membership was as follows at December 31, 2010 and 2009:
Change
2010 2009 Members Percentage
Medical Membership:
Government segment:
Medicare Advantage ........................... 1,733,800 1,508,500 225,300 14.9%
Medicare Advantage ASO ....................... 28,200 0 28,200 100.0%
Total Medicare Advantage ................... 1,762,000 1,508,500 253,500 16.8%
Medicare stand-alone PDP ....................... 1,758,800 1,927,900 (169,100) (8.8)%
Total Medicare ............................ 3,520,800 3,436,400 84,400 2.5%
Military services .............................. 1,755,200 1,756,000 (800) 0.0%
Military services ASO .......................... 1,272,600 1,278,400 (5,800) (0.5)%
Total military services ...................... 3,027,800 3,034,400 (6,600) (0.2)%
Medicaid .................................... 572,400 401,700 170,700 42.5%
Total Government ......................... 7,121,000 6,872,500 248,500 3.6%
Commercial segment:
Fully-insured ................................. 1,663,400 1,839,500 (176,100) (9.6)%
ASO ........................................ 1,453,600 1,571,300 (117,700) (7.5)%
Total Commercial ......................... 3,117,000 3,410,800 (293,800) (8.6)%
Total medical membership .......................... 10,238,000 10,283,300 (45,300) (0.4)%
Specialty Membership:
Commercial segment (a) ............................ 7,076,100 7,109,900 (33,800) (0.5)%
(a) The Commercial segment provides a full range of insured specialty products including dental, vision, and
other supplemental products. Members included in these products may not be unique to each product since
members have the ability to enroll in multiple products.
These tables of financial data should be reviewed in connection with the discussion that follows.
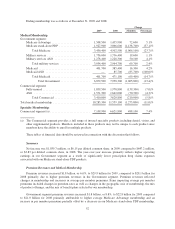
Summary
Net income was $1,099.4 million, or $6.47 per diluted common share, in 2010 compared to $1,039.7
million, or $6.15 per diluted common share, in 2009. The increase primarily was due to improved operating
performance in the Government segment as a result of an increase in average Medicare Advantage membership
and prior year favorable reserve releases not in the ordinary course of business in 2010 in both our Government
and Commercial segments. These increases were partially offset by a $147.5 million ($0.55 per diluted common
share) write-down of deferred acquisition costs associated with our individual major medical policies and a net
charge of $138.9 million ($0.52 per diluted common share) for reserve strengthening associated with our closed
block of long-term care policies in our Commercial Segment in 2010 as discussed in Note 18 to the consolidated
financial statements included in Item 8. – Financial Statements and Supplementary Data. Excluding these items,
Commercial segment pretax earnings improved year over year due to decreased utilization, our continued focus
on pricing discipline and administrative cost reductions, as well as the previously mentioned prior year favorable
reserve releases. The prior year favorable reserve development in both our Government and Commercial
segments (approximately $0.86 per diluted common share in 2010) primarily resulted from improvements in the
claims processing environment and, to a lesser extent, better than originally estimated utilization as well as a
shortening of the cycle time associated with provider claim submissions. Net income for 2009 also included the
favorable impact of the reduction of the liability for unrecognized tax benefits ($0.10 per diluted common share)
as a result of Internal Revenue Service audit settlements.
47