Humana 2010 Annual Report Download - page 143
Download and view the complete annual report
Please find page 143 of the 2010 Humana annual report below. You can navigate through the pages in the report by either clicking on the pages listed below, or by using the keyword search tool below to find specific information within the annual report.-
 1
1 -
2
-
3
-
4
-
5
-
6
-
7
-
8
-
9
-
10
-
11
-
12
-
13
-
14
-
15
-
16
-
17
-
18
-
19
-
20
-
21
-
22
-
23
-
24
-
25
-
26
-
27
-
28
-
29
-
30
-
31
-
32
-
33
-
34
-
35
-
36
-
37
-
38
-
39
-
40
-
41
-
42
-
43
-
44
-
45
-
46
-
47
-
48
-
49
-
50
-
51
-
52
-
53
-
54
-
55
-
56
-
57
-
58
-
59
-
60
-
61
-
62
-
63
-
64
-
65
-
66
-
67
-
68
-
69
-
70
-
71
-
72
-
73
-
74
-
75
-
76
-
77
-
78
-
79
-
80
-
81
-
82
-
83
-
84
-
85
-
86
-
87
-
88
-
89
-
90
-
91
-
92
-
93
-
94
-
95
-
96
-
97
-
98
-
99
-
100
-
101
-
102
-
103
-
104
-
105
-
106
-
107
-
108
-
109
-
110
-
111
-
112
-
113
-
114
-
115
-
116
-
117
-
118
-
119
-
120
-
121
-
122
-
123
-
124
-
125
-
126
-
127
-
128
-
129
-
130
-
131
-
132
-
 133
133 -
 134
134 -
 135
135 -
 136
136 -
 137
137 -
 138
138 -
 139
139 -
 140
140 -
 141
141 -
 142
142 -
 143
143 -
 144
144 -
 145
145 -
 146
146 -
 147
147 -
 148
148 -
 149
149 -
 150
150 -
 151
151 -
 152
152
 |
 |

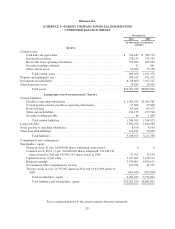
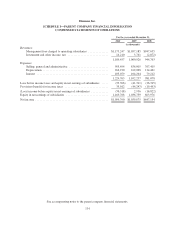
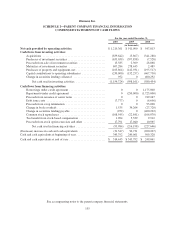
Humana Inc.
SCHEDULE I—PARENT COMPANY FINANCIAL INFORMATION
CONDENSED BALANCE SHEETS
December 31,
2010 2009
(in thousands, except share
amounts)
A
SSETS
Current assets:
Cash and cash equivalents ........................................... $ 314,445 $ 345,792
Investment securities ............................................... 239,132 319,792
Receivable from operating subsidiaries ................................ 379,406 469,635
Securities lending collateral ......................................... 11 961
Other current assets ................................................ 56,056 55,198
Total current assets ............................................ 989,050 1,191,378
Property and equipment, net ............................................. 478,615 471,671
Investments in subsidiaries .............................................. 8,758,660 7,197,247
Other long-term assets .................................................. 36,034 29,505
Total assets .................................................. $10,262,359 $8,889,801
L
IABILITIES AND
S
TOCKHOLDERS
’E
QUITY
Current liabilities:
Payable to operating subsidiaries ..................................... $ 1,365,874 $1,014,382
Current portion of notes payable to operating subsidiaries .................. 27,600 27,600
Book overdraft .................................................... 65,108 63,573
Other current liabilities ............................................. 126,133 277,518
Securities lending payable ........................................... 48 1,000
Total current liabilities ......................................... 1,584,763 1,384,073
Long-term debt ....................................................... 1,632,766 1,642,083
Notes payable to operating subsidiaries .................................... 8,550 8,550
Other long-term liabilities ............................................... 112,224 79,092
Total liabilities ............................................... 3,338,303 3,113,798
Commitments and contingencies
Stockholders’ equity:
Preferred stock, $1 par; 10,000,000 shares authorized; none issued .......... 0 0
Common stock, $0.16
2
⁄
3
par; 300,000,000 shares authorized; 190,244,741
shares issued in 2010 and 189,801,119 shares issued in 2009 ............. 31,707 31,634
Capital in excess of par value ........................................ 1,737,207 1,658,521
Retained earnings ................................................. 5,529,001 4,429,611
Accumulated other comprehensive income ............................. 120,584 42,135
Treasury stock, at cost, 21,795,051 shares in 2010 and 19,621,069 shares in
2009 .......................................................... (494,443) (385,898)
Total stockholders’ equity ....................................... 6,924,056 5,776,003
Total liabilities and stockholders’ equity ........................... $10,262,359 $8,889,801
See accompanying notes to the parent company financial statements.
133