Humana 2010 Annual Report Download - page 2
Download and view the complete annual report
Please find page 2 of the 2010 Humana annual report below. You can navigate through the pages in the report by either clicking on the pages listed below, or by using the keyword search tool below to find specific information within the annual report.-
 1
1 -
 2
2 -
 3
3 -
 4
4 -
 5
5 -
 6
6 -
 7
7 -
 8
8 -
 9
9 -
 10
10 -
 11
11 -
 12
12 -
 13
13 -
14
-
15
-
16
-
17
-
18
-
19
-
20
-
21
-
22
-
23
-
24
-
25
-
26
-
27
-
28
-
29
-
30
-
31
-
32
-
33
-
34
-
35
-
36
-
37
-
38
-
39
-
40
-
41
-
42
-
43
-
44
-
45
-
46
-
47
-
48
-
49
-
50
-
51
-
52
-
53
-
54
-
55
-
56
-
57
-
58
-
59
-
60
-
61
-
62
-
63
-
64
-
65
-
66
-
67
-
68
-
69
-
70
-
71
-
72
-
73
-
74
-
75
-
76
-
77
-
78
-
79
-
80
-
81
-
82
-
83
-
84
-
85
-
86
-
87
-
88
-
89
-
90
-
91
-
92
-
93
-
94
-
95
-
96
-
97
-
98
-
99
-
100
-
101
-
102
-
103
-
104
-
105
-
106
-
107
-
108
-
109
-
110
-
111
-
112
-
113
-
114
-
115
-
116
-
117
-
118
-
119
-
120
-
121
-
122
-
123
-
124
-
125
-
126
-
127
-
128
-
129
-
130
-
131
-
132
-
133
-
134
-
135
-
136
-
137
-
138
-
139
-
140
-
141
-
142
-
143
-
144
-
145
-
146
-
147
-
148
-
149
-
150
-
151
-
152
 |
 |

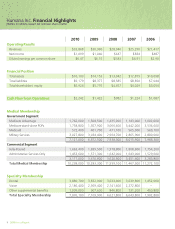
2010 2009 2008 2007 2006
Operating Results
Revenues $33,868 $30,960 $28,946 $25,290 $21,417
Net income $1,099 $1,040 $647 $834 $487
Diluted earnings per common share $6.47 $6.15 $3.83 $4.91 $2.90
Financial Position
Total assets $16,103 $14,153 $13,042 $12,879 $10,098
Total liabilities $9,179 $8,377 $8,585 $8,850 $7,044
Total shareholders’ equity $6,924 $5,776 $4,457 $4,029 $3,054
Cash Flow from Operations $2,242 $1,422 $982 $1,224 $1,687
Medical Membership
Government Segment
Medicare Advantage 1,762,000 1,508,500 1,435,900 1,143,000 1,002,600
Medicare stand-alone PDPs 1,758,800 1,927,900 3,066,600 3,442,000 3,536,600
Medicaid 572,400 401,700 471,100 565,000 569,100
Military Services 3,027,800 3,034,400 2,964,700 2,865,900 2,880,000
7,121,000 6,872,500 7,938,300 8,015,900 7,988,300
Commercial Segment
Fully-Insured 1,663,400 1,839,500 1,978,800 1,808,600 1,754,200
Administrative Services Only 1,453,600 1,571,300 1,642,000 1,643,000 1,529,600
3,117,000 3,410,800 3,620,800 3,451,600 3,283,800
Total Medical Membership 10,238,000 10,283,300 11,559,100 11,467,500 11,272,100
Specialty Membership
Dental 3,880,700 3,832,900 3,633,400 3,639,800 1,452,000
Vision 2,186,400 2,369,400 2,141,600 2,272,800 –
Other supplemental benefits 1,009,000 907,600 846,800 731,200 450,800
Total Specialty Membership 7,076,100 7,109,900 6,621,800 6,643,800 1,902,800
1 2010AnnualReport
Humana Inc. Financial Highlights
(dollars in millions, except per common share results)