Humana 2010 Annual Report Download - page 145
Download and view the complete annual report
Please find page 145 of the 2010 Humana annual report below. You can navigate through the pages in the report by either clicking on the pages listed below, or by using the keyword search tool below to find specific information within the annual report.-
 1
1 -
2
-
3
-
4
-
5
-
6
-
7
-
8
-
9
-
10
-
11
-
12
-
13
-
14
-
15
-
16
-
17
-
18
-
19
-
20
-
21
-
22
-
23
-
24
-
25
-
26
-
27
-
28
-
29
-
30
-
31
-
32
-
33
-
34
-
35
-
36
-
37
-
38
-
39
-
40
-
41
-
42
-
43
-
44
-
45
-
46
-
47
-
48
-
49
-
50
-
51
-
52
-
53
-
54
-
55
-
56
-
57
-
58
-
59
-
60
-
61
-
62
-
63
-
64
-
65
-
66
-
67
-
68
-
69
-
70
-
71
-
72
-
73
-
74
-
75
-
76
-
77
-
78
-
79
-
80
-
81
-
82
-
83
-
84
-
85
-
86
-
87
-
88
-
89
-
90
-
91
-
92
-
93
-
94
-
95
-
96
-
97
-
98
-
99
-
100
-
101
-
102
-
103
-
104
-
105
-
106
-
107
-
108
-
109
-
110
-
111
-
112
-
113
-
114
-
115
-
116
-
117
-
118
-
119
-
120
-
121
-
122
-
123
-
124
-
125
-
126
-
127
-
128
-
129
-
130
-
131
-
132
-
133
-
134
-
 135
135 -
 136
136 -
 137
137 -
 138
138 -
 139
139 -
 140
140 -
 141
141 -
 142
142 -
 143
143 -
 144
144 -
 145
145 -
 146
146 -
 147
147 -
 148
148 -
 149
149 -
 150
150 -
 151
151 -
 152
152
 |
 |

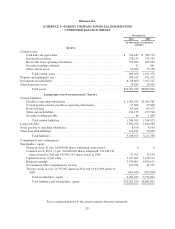
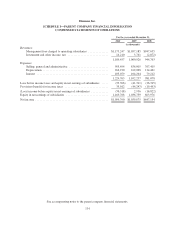
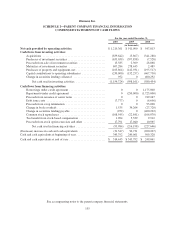
Humana Inc.
SCHEDULE I—PARENT COMPANY FINANCIAL INFORMATION
CONDENSED STATEMENTS OF CASH FLOWS
For the year ended December 31,
2010 2009 2008
(in thousands)
Net cash provided by operating activities $ 1,219,361 $ 911,090 $ 547,813
Cash flows from investing activities:
Acquisitions ........................................... (839,642) (5,867) (341,288)
Purchases of investment securities .......................... (633,039) (597,858) (7,528)
Proceeds from sale of investment securities .................. 15,585 2,309 28,868
Maturities of investment securities ......................... 697,284 278,443 2,489
Purchases of property and equipment, net .................... (165,864) (142,931) (195,517)
Capital contributions to operating subsidiaries ................ (230,000) (132,257) (467,750)
Change in securities lending collateral ...................... 952 0 400,292
Net cash used in investing activities .................... (1,154,724) (598,161) (580,434)
Cash flows from financing activities:
Borrowings under credit agreement ......................... 0 0 1,175,000
Repayments under credit agreement ........................ 0 (250,000) (1,725,000)
Proceeds from issuance of senior notes ...................... 0 0 749,247
Debt issue costs ........................................ (7,777) 0 (6,696)
Proceeds from swap termination ........................... 0 0 93,008
Change in book overdraft ................................. 1,535 34,264 (27,720)
Change in securities lending payable ........................ (952) 0 (400,292)
Common stock repurchases ............................... (108,545) (22,841) (106,070)
Tax benefit from stock-based compensation .................. 1,964 5,339 9,912
Proceeds from stock option exercises and other ............... 17,791 17,040 10,965
Net cash used in financing activities .................... (95,984) (216,198) (227,646)
(Decrease) increase in cash and cash equivalents .................. (31,347) 96,731 (260,267)
Cash and cash equivalents at beginning of year .................... 345,792 249,061 509,328
Cash and cash equivalents at end of year ......................... $ 314,445 $ 345,792 $ 249,061
See accompanying notes to the parent company financial statements.
135