Electronic Arts 2015 Annual Report Download - page 107
Download and view the complete annual report
Please find page 107 of the 2015 Electronic Arts annual report below. You can navigate through the pages in the report by either clicking on the pages listed below, or by using the keyword search tool below to find specific information within the annual report.-
 1
1 -
2
-
3
-
4
-
5
-
6
-
7
-
8
-
9
-
10
-
11
-
12
-
13
-
14
-
15
-
16
-
17
-
18
-
19
-
20
-
21
-
22
-
23
-
24
-
25
-
26
-
27
-
28
-
29
-
30
-
31
-
32
-
33
-
34
-
35
-
36
-
37
-
38
-
39
-
40
-
41
-
42
-
43
-
44
-
45
-
46
-
47
-
48
-
49
-
50
-
51
-
52
-
53
-
54
-
55
-
56
-
57
-
58
-
59
-
60
-
61
-
62
-
63
-
64
-
65
-
66
-
67
-
68
-
69
-
70
-
71
-
72
-
73
-
74
-
75
-
76
-
77
-
78
-
79
-
80
-
81
-
82
-
83
-
84
-
85
-
86
-
87
-
88
-
89
-
90
-
91
-
92
-
93
-
94
-
95
-
96
-
 97
97 -
 98
98 -
 99
99 -
 100
100 -
 101
101 -
 102
102 -
 103
103 -
 104
104 -
 105
105 -
 106
106 -
 107
107 -
 108
108 -
 109
109 -
 110
110 -
 111
111 -
 112
112 -
 113
113 -
 114
114 -
 115
115 -
 116
116 -
 117
117 -
118
-
119
-
120
-
121
-
122
-
123
-
124
-
125
-
126
-
127
-
128
-
129
-
130
-
131
-
132
-
133
-
134
-
135
-
136
-
137
-
138
-
139
-
140
-
141
-
142
-
143
-
144
-
145
-
146
-
147
-
148
-
149
-
150
-
151
-
152
-
153
-
154
-
155
-
156
-
157
-
158
-
159
-
160
-
161
-
162
-
163
-
164
-
165
-
166
-
167
-
168
-
169
-
170
-
171
-
172
-
173
-
174
-
175
-
176
-
177
-
178
-
179
-
180
 |
 |

Annual Report
RESULTS OF OPERATIONS
Our fiscal year is reported on a 52- or 53-week period that ends on the Saturday nearest March 31. Our results of
operations for the fiscal years ended March 31, 2015, 2014 and 2013 each contained 52 weeks and ended on
March 28, 2015, March 29, 2014, and March 30, 2013, respectively. For simplicity of disclosure, all fiscal
periods are referred to as ending on a calendar month-end.
Net Revenue
Net revenue consists of sales generated from (1) video games sold as packaged goods or as digital downloads and
designed for play on video game consoles (such as the PlayStation 3 and 4 from Sony, and the Xbox 360 and One
from Microsoft) and PCs, (2) video games for mobile phones and tablets, (3) separate software products and
content and online game services associated with these products, (4) licensing our game software to third parties,
(5) allowing other companies to manufacture and sell our products in conjunction with other products, and
(6) advertisements on our online web pages and in our games.
We provide two different measures of our Net Revenue. One of these measures is presented in accordance with
U.S. GAAP — Net Revenue by Product revenue and Service and other revenue. The second measure is a non-
GAAP financial measure — Net Revenue before Revenue Deferral by Revenue Composition, which is primarily
based on method of distribution. We use this second non-GAAP financial measure internally to evaluate our
operating performance, when planning, forecasting and analyzing future periods, and when assessing the
performance of our management team.
Management places a greater emphasis and focus on assessing our business through a review of the Net Revenue
before Revenue Deferral by Revenue Composition than by Net Revenue by Product revenue and Service and
other revenue. These two measures differ as (1) Net Revenue by Product revenue and Service and other revenue
reflects the deferral and recognition of revenue in periods subsequent to the date of sale due to U.S. GAAP while
Net Revenue before Revenue Deferral by Revenue Composition does not, and (2) both measures contain a
different aggregation of sales from one another. For instance, Service and other revenue does not include a
portion of our full-game digital download and mobile sales that are fully included in our Digital revenue. Further,
Service and other revenue includes all of our revenue associated with MMO games while software sales
associated with our MMOs are included in either Digital revenue or Packaged goods and other revenue
depending on whether the sale was a full-game digital download or a packaged goods sale.
Comparison of Fiscal Year 2015 to Fiscal Year 2014
Net Revenue
For fiscal year 2015, net revenue was $4,515 million and increased $940 million, or 26 percent, as compared to
fiscal year 2014. This increase was driven by a $1,481 million increase in revenue primarily from the FIFA and
Madden NFL franchises, and Titanfall. This increase was partially offset by a $541 million decrease in revenue
primarily from the SimCity, Crysis, Dead Space, and NCAA Football franchises, and Star Wars: The Old
Republic.
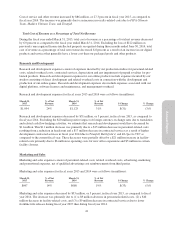
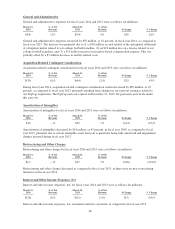
Net Revenue by Product Revenue and Service and Other Revenue
Our net revenue by product revenue and service and other revenue for fiscal years 2015 and 2014 was as follows
(in millions):
Year Ended March 31,
2015 2014 $ Change % Change
Net revenue:
Product ................................................ $2,568 $2,134 $434 20%
Service and other ........................................ $1,947 $1,441 $506 35%
Total net revenue ...................................... $4,515 $3,575 $940 26%
37