Electronic Arts 2015 Annual Report Download - page 138
Download and view the complete annual report
Please find page 138 of the 2015 Electronic Arts annual report below. You can navigate through the pages in the report by either clicking on the pages listed below, or by using the keyword search tool below to find specific information within the annual report.-
 1
1 -
2
-
3
-
4
-
5
-
6
-
7
-
8
-
9
-
10
-
11
-
12
-
13
-
14
-
15
-
16
-
17
-
18
-
19
-
20
-
21
-
22
-
23
-
24
-
25
-
26
-
27
-
28
-
29
-
30
-
31
-
32
-
33
-
34
-
35
-
36
-
37
-
38
-
39
-
40
-
41
-
42
-
43
-
44
-
45
-
46
-
47
-
48
-
49
-
50
-
51
-
52
-
53
-
54
-
55
-
56
-
57
-
58
-
59
-
60
-
61
-
62
-
63
-
64
-
65
-
66
-
67
-
68
-
69
-
70
-
71
-
72
-
73
-
74
-
75
-
76
-
77
-
78
-
79
-
80
-
81
-
82
-
83
-
84
-
85
-
86
-
87
-
88
-
89
-
90
-
91
-
92
-
93
-
94
-
95
-
96
-
97
-
98
-
99
-
100
-
101
-
102
-
103
-
104
-
105
-
106
-
107
-
108
-
109
-
110
-
111
-
112
-
113
-
114
-
115
-
116
-
117
-
118
-
119
-
120
-
121
-
122
-
123
-
124
-
125
-
126
-
127
-
 128
128 -
 129
129 -
 130
130 -
 131
131 -
 132
132 -
 133
133 -
 134
134 -
 135
135 -
 136
136 -
 137
137 -
 138
138 -
 139
139 -
 140
140 -
 141
141 -
 142
142 -
 143
143 -
 144
144 -
 145
145 -
 146
146 -
 147
147 -
 148
148 -
149
-
150
-
151
-
152
-
153
-
154
-
155
-
156
-
157
-
158
-
159
-
160
-
161
-
162
-
163
-
164
-
165
-
166
-
167
-
168
-
169
-
170
-
171
-
172
-
173
-
174
-
175
-
176
-
177
-
178
-
179
-
180
 |
 |

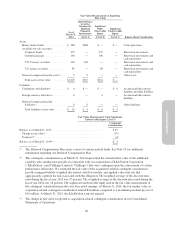
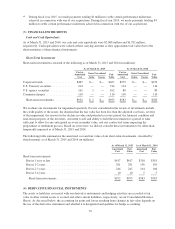
Assets and Liabilities Measured at Fair Value on a Recurring Basis
As of March 31, 2015 and 2014, our assets and liabilities that were measured and recorded at fair value on a
recurring basis were as follows (in millions):
Fair Value Measurements at Reporting
Date Using
As of
March 31,
2015
Quoted
Prices in
Active
Markets for
Identical
Financial
Instruments
Significant
Other
Observable
Inputs
Significant
Unobservable
Inputs
(Level 1) (Level 2) (Level 3) Balance Sheet Classification
Assets
Bank and time deposits ................ $ 175 $175 $ — $— Cash equivalents
Money market funds .................. 7 7 — — Cash equivalents
Available-for-sale securities:
Corporate bonds ................... 468 — 468 — Short-term investments and
cash equivalents
U.S. Treasury securities ............. 214 214 — — Short-term investments
U.S. agency securities ............... 180 — 180 — Short-term investments and
cash equivalents
Commercial paper .................. 140 140 Short-term investments and
cash equivalents
Foreign currency derivatives ............ 18 — 18 — Other current assets
Deferred compensation plan assets(a) ..... 9 9 — — Other assets
Total assets at fair value ............. $1,211 $405 $806 $—
Liabilities
Contingent consideration(b) ............. $ — $ — $ — $— Accrued and other current
liabilities
Foreign currency derivatives ............ 9 — 9 — Accrued and other current
liabilities
Deferred compensation plan liabilities(a) . . . 9 9 — — Other liabilities
Total liabilities at fair value .......... $ 18 $ 9 $ 9 $—
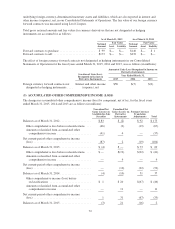
Fair Value Measurements Using
Significant Unobservable Inputs (Level 3)
Contingent
Consideration
Balance as of March 31, 2014 ...................................... $ 4
Change in fair value(c) ........................................... (3)
Payments(d) ................................................... (1)
Balance as of March 31, 2015(b) ..................................... $—
68