Electronic Arts 2015 Annual Report Download - page 113
Download and view the complete annual report
Please find page 113 of the 2015 Electronic Arts annual report below. You can navigate through the pages in the report by either clicking on the pages listed below, or by using the keyword search tool below to find specific information within the annual report.-
 1
1 -
2
-
3
-
4
-
5
-
6
-
7
-
8
-
9
-
10
-
11
-
12
-
13
-
14
-
15
-
16
-
17
-
18
-
19
-
20
-
21
-
22
-
23
-
24
-
25
-
26
-
27
-
28
-
29
-
30
-
31
-
32
-
33
-
34
-
35
-
36
-
37
-
38
-
39
-
40
-
41
-
42
-
43
-
44
-
45
-
46
-
47
-
48
-
49
-
50
-
51
-
52
-
53
-
54
-
55
-
56
-
57
-
58
-
59
-
60
-
61
-
62
-
63
-
64
-
65
-
66
-
67
-
68
-
69
-
70
-
71
-
72
-
73
-
74
-
75
-
76
-
77
-
78
-
79
-
80
-
81
-
82
-
83
-
84
-
85
-
86
-
87
-
88
-
89
-
90
-
91
-
92
-
93
-
94
-
95
-
96
-
97
-
98
-
99
-
100
-
101
-
102
-
 103
103 -
 104
104 -
 105
105 -
 106
106 -
 107
107 -
 108
108 -
 109
109 -
 110
110 -
 111
111 -
 112
112 -
 113
113 -
 114
114 -
 115
115 -
 116
116 -
 117
117 -
 118
118 -
 119
119 -
 120
120 -
 121
121 -
 122
122 -
 123
123 -
124
-
125
-
126
-
127
-
128
-
129
-
130
-
131
-
132
-
133
-
134
-
135
-
136
-
137
-
138
-
139
-
140
-
141
-
142
-
143
-
144
-
145
-
146
-
147
-
148
-
149
-
150
-
151
-
152
-
153
-
154
-
155
-
156
-
157
-
158
-
159
-
160
-
161
-
162
-
163
-
164
-
165
-
166
-
167
-
168
-
169
-
170
-
171
-
172
-
173
-
174
-
175
-
176
-
177
-
178
-
179
-
180
 |
 |

Annual Report
tax authorities, applicable accounting rules, applicable tax laws and regulations, rulings and interpretations
thereof, developments in tax audit and other matters, and variations in our annual pre-tax income or loss. We
incur certain tax expenses that do not decline proportionately with declines in our pre-tax consolidated income or
loss. As a result, in absolute dollar terms, our tax expense will have a greater influence on our effective tax rate at
lower levels of pre-tax income or loss than at higher levels. In addition, at lower levels of pre-tax income or loss,
our effective tax rate will be more volatile.
Certain taxable temporary differences that are not expected to reverse during the carry forward periods permitted
by tax law have not been considered as a source of future taxable income that is available to realize the benefit of
deferred tax assets.
Historically, we have considered undistributed earnings of our foreign subsidiaries to be indefinitely reinvested
outside of the United States and, accordingly, no U.S. taxes have been provided thereon. We currently intend to
continue to indefinitely reinvest the undistributed earnings of our foreign subsidiaries outside of the United
States.
Comparison of Fiscal Year 2014 to Fiscal Year 2013
Net Revenue
For fiscal year 2014, Net Revenue was $3,575 million and decreased $222 million, or 6 percent, as compared to
fiscal year 2013. This decrease was driven by a $745 million decrease in revenue primarily from the Mass Effect,
Madden NFL, Medal of Honor, The Sims, and FIFA Street franchises. This decrease was partially offset by a
$523 million increase in revenue primarily from the Battlefield, SimCity, Crysis franchises, and The Simpsons:
Tapped Out.
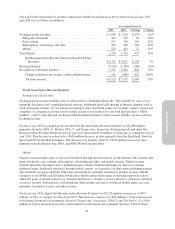
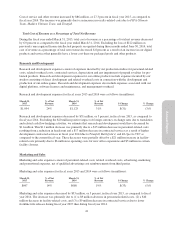
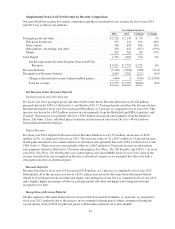
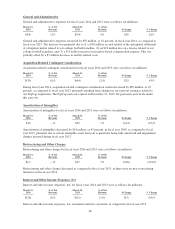
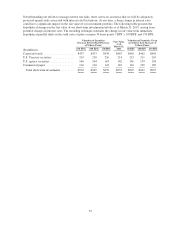
Net Revenue by Product Revenue and Service and Other Revenue
Our net revenue by product revenue and service and other revenue for fiscal years 2014 and 2013 was as follows
(in millions):
Year Ended March 31,
2014 2013 $ Change % Change
Net revenue:
Product ................................................ $2,134 $2,738 $(604) (22)%
Service and other ........................................ $1,441 $1,059 $ 382 36%
Total net revenue ...................................... $3,575 $3,797 $(222) (6)%
Product Revenue
For fiscal year 2014, product revenue was $2,134 million, primarily driven by FIFA 14,Battlefield 4, and FIFA
13. Product revenue decreased $604 million, or 22 percent, as compared to fiscal year 2013. This decrease was
driven by an $842 million decrease primarily from the Mass Effect, Madden NFL, FIFA, Medal of Honor, and
FIFA Street franchises. This decrease was partially offset by a $238 million increase primarily from the
Battlefield, Dead Space, and Crysis franchises.
Service and Other Revenue
For fiscal year 2014, service and other revenue was $1,441 million, primarily driven by FIFA Ultimate Team,
Star Wars: The Old Republic, and SimCity. Service and other revenue for fiscal year 2014 increased $382
million, or 36 percent, as compared to fiscal year 2013. This increase was driven by a $468 million increase
primarily from the FIFA and SimCity franchises, and The Simpsons: Tapped Out. This increase was partially
offset by an $86 million decrease primarily from lower revenue from The Sims Social, which shut down in June
2013, Star Wars: The Old Republic, as well as Pogo-branded online game services.
43