Electronic Arts 2015 Annual Report Download - page 97
Download and view the complete annual report
Please find page 97 of the 2015 Electronic Arts annual report below. You can navigate through the pages in the report by either clicking on the pages listed below, or by using the keyword search tool below to find specific information within the annual report.-
 1
1 -
2
-
3
-
4
-
5
-
6
-
7
-
8
-
9
-
10
-
11
-
12
-
13
-
14
-
15
-
16
-
17
-
18
-
19
-
20
-
21
-
22
-
23
-
24
-
25
-
26
-
27
-
28
-
29
-
30
-
31
-
32
-
33
-
34
-
35
-
36
-
37
-
38
-
39
-
40
-
41
-
42
-
43
-
44
-
45
-
46
-
47
-
48
-
49
-
50
-
51
-
52
-
53
-
54
-
55
-
56
-
57
-
58
-
59
-
60
-
61
-
62
-
63
-
64
-
65
-
66
-
67
-
68
-
69
-
70
-
71
-
72
-
73
-
74
-
75
-
76
-
77
-
78
-
79
-
80
-
81
-
82
-
83
-
84
-
85
-
86
-
 87
87 -
 88
88 -
 89
89 -
 90
90 -
 91
91 -
 92
92 -
 93
93 -
 94
94 -
 95
95 -
 96
96 -
 97
97 -
 98
98 -
 99
99 -
 100
100 -
 101
101 -
 102
102 -
 103
103 -
 104
104 -
 105
105 -
 106
106 -
 107
107 -
108
-
109
-
110
-
111
-
112
-
113
-
114
-
115
-
116
-
117
-
118
-
119
-
120
-
121
-
122
-
123
-
124
-
125
-
126
-
127
-
128
-
129
-
130
-
131
-
132
-
133
-
134
-
135
-
136
-
137
-
138
-
139
-
140
-
141
-
142
-
143
-
144
-
145
-
146
-
147
-
148
-
149
-
150
-
151
-
152
-
153
-
154
-
155
-
156
-
157
-
158
-
159
-
160
-
161
-
162
-
163
-
164
-
165
-
166
-
167
-
168
-
169
-
170
-
171
-
172
-
173
-
174
-
175
-
176
-
177
-
178
-
179
-
180
 |
 |

Annual Report
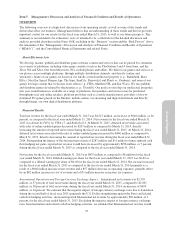
Item 7: Management’s Discussion and Analysis of Financial Condition and Results of Operations
OVERVIEW
The following overview is a high-level discussion of our operating results, as well as some of the trends and
drivers that affect our business. Management believes that an understanding of these trends and drivers provides
important context for our results for the fiscal year ended March 31, 2015, as well as our future prospects. This
summary is not intended to be exhaustive, nor is it intended to be a substitute for the detailed discussion and
analysis provided elsewhere in this Form 10-K, including in the “Business” section and the “Risk Factors” above,
the remainder of this “Management’s Discussion and Analysis of Financial Condition and Results of Operations
(“MD&A”)”, and the Consolidated Financial Statements and related Notes.
About Electronic Arts
We develop, market, publish and distribute game software content and services that can be played by consumers
on a variety of platforms, including video game consoles (such as the PlayStation 3 and 4 from Sony, and the
Xbox 360 and Xbox One from Microsoft), PCs, mobile phones and tablets. We deliver our games and services to
our players across multiple platforms, through multiple distribution channels, and directly (online and
wirelessly). Some of our games are based on our wholly-owned intellectual property (e.g., Battlefield, Mass
Effect, Need for Speed, Dragon Age, The Sims, SimCity, Bejeweled, and Plants vs. Zombies), and some of our
games leverage content that we license from others (e.g., FIFA, Madden NFL and Star Wars). We also publish
and distribute games developed by third parties (e.g.,Titanfall). Our goal is to develop our intellectual properties
into year-round businesses available on a range of platforms. Our products and services may be purchased
through physical and online retailers, platform providers such as console manufacturers, providers of free-to-
download PC games played on the Internet, mobile carriers via streaming and digital downloads and directly
through Origin, our own digital distribution platform.
Financial Results
Total net revenue for the fiscal year ended March 31, 2015 was $4,515 million, an increase of $940 million, or 26
percent, as compared to the fiscal year ended March 31, 2014. Net revenue for the fiscal year ended March 31,
2015 was driven by FIFA 14,FIFA 15, and Battlefield 4. At March 31, 2015, deferred net revenue associated
with sales of online-enabled games decreased by $207 million as compared to March 31, 2014, directly
increasing the amount of reported net revenue during the fiscal year ended March 31, 2015. At March 31, 2014,
deferred net revenue associated with sales of online-enabled games increased by $446 million as compared to
March 31, 2013, directly decreasing the amount of reported net revenue during the fiscal year ended March 31,
2014. Disregarding the impact of the deferred net revenue of $287 million and $11 million of unrecognized cash
flow hedging net gains, reported net revenue would have increased by approximately $298 million, or 7 percent,
during the fiscal year ended March 31, 2015 as compared to the fiscal year ended March 31, 2014.
Net income for the fiscal year ended March 31, 2015 was $875 million as compared to $8 million for the fiscal
year ended March 31, 2014. Diluted earnings per share for the fiscal year ended March 31, 2015 was $2.69 as
compared to a diluted earnings per share of $0.03 for the fiscal year ended March 31, 2014. Net income increased
for the fiscal year ended March 31, 2015 as compared to the fiscal year ended March 31, 2014 primarily as a
result of a $940 million increase in net revenue and a $57 million decrease in operating expenses, partially offset
by an $82 million increase in cost of revenue and a $51 million increase in income tax expenses.
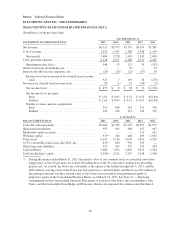
International Operations and Foreign Currency Exchange Impact. International net revenue was $2,559
million, or 57 percent of total net revenue during the fiscal year ended March 31, 2015, compared to $2,065
million, or 58 percent of total net revenue during the fiscal year ended March 31, 2014, an increase of $494
million, or 24 percent. We estimate that the negative impact of foreign currency exchange rates due to translation
during the second half of fiscal year 2015 (primarily the U.S. Dollar strengthening against the Euro) and related
cash flow hedging activities, decreased reported International net revenue by approximately $30 million, or 1
percent, for the fiscal year ended March 31, 2015. Excluding the negative impact of foreign currency exchange
rates from translation and related cash flow hedging activities, we estimate that International net revenue would
27