Electronic Arts 2015 Annual Report Download - page 165
Download and view the complete annual report
Please find page 165 of the 2015 Electronic Arts annual report below. You can navigate through the pages in the report by either clicking on the pages listed below, or by using the keyword search tool below to find specific information within the annual report.-
 1
1 -
2
-
3
-
4
-
5
-
6
-
7
-
8
-
9
-
10
-
11
-
12
-
13
-
14
-
15
-
16
-
17
-
18
-
19
-
20
-
21
-
22
-
23
-
24
-
25
-
26
-
27
-
28
-
29
-
30
-
31
-
32
-
33
-
34
-
35
-
36
-
37
-
38
-
39
-
40
-
41
-
42
-
43
-
44
-
45
-
46
-
47
-
48
-
49
-
50
-
51
-
52
-
53
-
54
-
55
-
56
-
57
-
58
-
59
-
60
-
61
-
62
-
63
-
64
-
65
-
66
-
67
-
68
-
69
-
70
-
71
-
72
-
73
-
74
-
75
-
76
-
77
-
78
-
79
-
80
-
81
-
82
-
83
-
84
-
85
-
86
-
87
-
88
-
89
-
90
-
91
-
92
-
93
-
94
-
95
-
96
-
97
-
98
-
99
-
100
-
101
-
102
-
103
-
104
-
105
-
106
-
107
-
108
-
109
-
110
-
111
-
112
-
113
-
114
-
115
-
116
-
117
-
118
-
119
-
120
-
121
-
122
-
123
-
124
-
125
-
126
-
127
-
128
-
129
-
130
-
131
-
132
-
133
-
134
-
135
-
136
-
137
-
138
-
139
-
140
-
141
-
142
-
143
-
144
-
145
-
146
-
147
-
148
-
149
-
150
-
151
-
152
-
153
-
154
-
 155
155 -
 156
156 -
 157
157 -
 158
158 -
 159
159 -
 160
160 -
 161
161 -
 162
162 -
 163
163 -
 164
164 -
 165
165 -
 166
166 -
 167
167 -
 168
168 -
 169
169 -
 170
170 -
 171
171 -
 172
172 -
 173
173 -
 174
174 -
 175
175 -
176
-
177
-
178
-
179
-
180
 |
 |

Annual Report
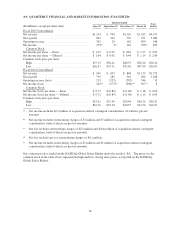
Information about our operations in North America and internationally as of and for the fiscal years ended
March 31, 2015, 2014 and 2013 is presented below (in millions):
Year Ended March 31,
2015 2014 2013
Net revenue from unaffiliated customers
North America ...................................................... $1,956 $1,510 $1,701
International ........................................................ 2,559 2,065 2,096
Total ............................................................ $4,515 $3,575 $3,797
As of March 31,
2015 2014
Long-lived assets
North America .............................................................. $1,809 $1,940
International ............................................................... 474 470
Total ................................................................... $2,283 $2,410
We attribute net revenue from external customers to individual countries based on the location of the legal entity
that sells the products and/or services. Note that revenue attributed to the legal entity that makes the sale is often
not the country where the consumer resides. For example, revenue generated by our Swiss legal entities includes
digital revenue from consumers who reside outside of Switzerland, including consumers who reside outside of
Europe. Revenue generated by our Swiss legal entities during fiscal years 2015, 2014, and 2013 represents
$1,462 million, $1,171 million and $885 million or 32 percent, 33 percent and 23 percent of our total net
revenue, respectively. Revenue generated in the United States represents over 99 percent of our total North
America net revenue. There were no other countries with net revenue greater than 10 percent.
Our direct sales to GameStop Corp. represented approximately 11 percent, 13 percent, and 13 percent of total net
revenue in fiscal years 2015, 2014, and 2013, respectively. In fiscal year 2015, our direct sales to Microsoft
represented approximately 10 percent of total net revenue. Our direct sales to Microsoft did not exceed 10
percent of net revenue in fiscal years 2014 and 2013.
95