Electronic Arts 2015 Annual Report Download - page 48
Download and view the complete annual report
Please find page 48 of the 2015 Electronic Arts annual report below. You can navigate through the pages in the report by either clicking on the pages listed below, or by using the keyword search tool below to find specific information within the annual report.-
 1
1 -
2
-
3
-
4
-
5
-
6
-
7
-
8
-
9
-
10
-
11
-
12
-
13
-
14
-
15
-
16
-
17
-
18
-
19
-
20
-
21
-
22
-
23
-
24
-
25
-
26
-
27
-
28
-
29
-
30
-
31
-
32
-
33
-
34
-
35
-
36
-
37
-
 38
38 -
 39
39 -
 40
40 -
 41
41 -
 42
42 -
 43
43 -
 44
44 -
 45
45 -
 46
46 -
 47
47 -
 48
48 -
 49
49 -
 50
50 -
 51
51 -
 52
52 -
 53
53 -
 54
54 -
 55
55 -
 56
56 -
 57
57 -
 58
58 -
59
-
60
-
61
-
62
-
63
-
64
-
65
-
66
-
67
-
68
-
69
-
70
-
71
-
72
-
73
-
74
-
75
-
76
-
77
-
78
-
79
-
80
-
81
-
82
-
83
-
84
-
85
-
86
-
87
-
88
-
89
-
90
-
91
-
92
-
93
-
94
-
95
-
96
-
97
-
98
-
99
-
100
-
101
-
102
-
103
-
104
-
105
-
106
-
107
-
108
-
109
-
110
-
111
-
112
-
113
-
114
-
115
-
116
-
117
-
118
-
119
-
120
-
121
-
122
-
123
-
124
-
125
-
126
-
127
-
128
-
129
-
130
-
131
-
132
-
133
-
134
-
135
-
136
-
137
-
138
-
139
-
140
-
141
-
142
-
143
-
144
-
145
-
146
-
147
-
148
-
149
-
150
-
151
-
152
-
153
-
154
-
155
-
156
-
157
-
158
-
159
-
160
-
161
-
162
-
163
-
164
-
165
-
166
-
167
-
168
-
169
-
170
-
171
-
172
-
173
-
174
-
175
-
176
-
177
-
178
-
179
-
180
 |
 |

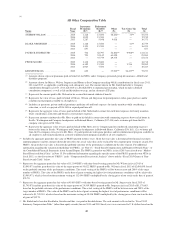
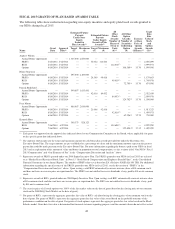
FISCAL 2015 GRANTS OF PLAN-BASED AWARDS TABLE
The following table shows information regarding non-equity incentive and equity plan-based awards granted to
our NEOs during fiscal 2015.
Name
Grant
Date
Approval
Date(1)
Estimated Future
Payouts
Under Non-
Equity
Incentive
Plan Awards(2)
Estimated Future
Payouts
Under Equity
Incentive Plan
Awards(3)
All
Other
Stock
Awards:
Number of
Shares of
Stock or
Units
(#)(4)
All Other
Option
Awards:
Number of
Securities
Underlying
Option
(#)
Exercise
or Base
Price of
Option
Awards
($/Share)(5)
Grant
Date
Fair
Value of
Stock
and
Option
Awards
($)(6)
Target
($)
Maximum
($)
Target
(#)
Maximum
(#)
Andrew Wilson ..........
Annual Bonus Opportunity — — 1,325,000 2,650,000 — — — — — —
PRSUs 6/16/2014 5/16/2014 — — 56,022 112,044 — — — 2,696,899
RSUs 6/16/2014 5/16/2014 — — — — 112,044(7) — — 3,999,971
Options 6/16/2014 5/16/2014 — — — — — 166,389(8) 35.70 1,999,996
Blake Jorgensen ..........
Annual Bonus Opportunity — — 695,000 2,100,000 — — — — — —
PRSUs 6/16/2014 5/15/2014 — — 24,509 49,018 — — — 1,179,863
RSUs 6/16/2014 5/15/2014 — — — — 49,019(7) — — 1,749,978
Options 6/16/2014 5/15/2014 — — — — — 72,795(8) 35.70 874,996
Patrick Söderlund .........
Annual Bonus Opportunity — — 540,897 1,655,601 — — — — — —
PRSUs 6/16/2014 5/15/2014 — — 42,016 84,032 — — — 2,022,650
RSUs 6/16/2014 5/15/2014 — — — — 84,033(7) — — 2,999,978
Options 6/16/2014 5/15/2014 — — — — — 124,792(8) 35.70 1,500,000
Peter Moore .............
Annual Bonus Opportunity — — 666,667 2,010,000 — — — — — —
PRSUs 6/16/2014 5/15/2014 — — 21,008 42,016 — — — 1,011,325
RSUs 6/16/2014 5/15/2014 — — — — 42,016(7) — — 1,499,971
Options 6/16/2014 5/15/2014 — — — — — 62,396(8) 35.70 750,000
Kenneth Moss ............
Annual Bonus Opportunity — — 309,375 928,125 — — — — — —
RSUs 7/16/2014 6/5/2014 — — — — 134,698(9) — — 4,999,990
Options 7/16/2014 6/5/2014 — — — — — 122,850(10) 37.12 1,499,999
(1) Each grant was approved on the approval date indicated above by our Compensation Committee or the Board, where applicable, for grant
on the specific grant date indicated above.
(2) The amounts shown represent the target and maximum amount of cash bonus plan awards provided for under the Electronic Arts
Executive Bonus Plan. The target amounts are pre-established as a percentage of salary and the maximum amounts represent the greatest
payout that could be made pursuant to the Executive Bonus Plan. For more information regarding the bonuses paid to our NEOs in fiscal
2015 and an explanation of the amount of salary and bonus in proportion to total compensation, see the sections titled “Our NEOs’ Fiscal
2015 Compensation” and “Our Elements of Pay” in the “Compensation Discussion and Analysis” above.
(3) Represents awards of PRSUs granted under our 2000 Equity Incentive Plan. The PRSUs granted to our NEOs in fiscal 2015 are referred
to as “Market-Based Restricted Stock Units” in Note 15 “Stock-Based Compensation and Employee Benefit Plans”, to the Consolidated
Financial Statements in our Annual Report. The number of PRSUs that vest is based on EA’s Relative NASDAQ-100 TSR. For additional
information regarding the specific terms of the PRSUs granted to our NEOs in fiscal 2015, see the discussion of “PRSUs” in the
“Compensation Discussion and Analysis” above. Upon vesting, each PRSU automatically converts into one share of EA common stock,
and does not have an exercise price or expiration date. The PRSUs are not entitled to receive dividends, if any, paid by EA on its common
stock.
(4) Represents awards of RSUs granted under our 2000 Equity Incentive Plan. Upon vesting, each RSU automatically converts into one share
of EA common stock, and does not have an exercise price or expiration date. The RSUs are not entitled to receive dividends, if any, paid
by EA on its common stock.
(5) The exercise price of all stock options was 100% of the fair market value on the date of grant (based on the closing price of our common
stock on the NASDAQ Stock Market on the date of grant).
(6) For grants of RSUs, represents the aggregate grant date fair value of RSUs calculated using the closing price of our common stock on the
date of grant. For grants of PRSUs, represents the aggregate grant date fair value of the award based on the probable outcome of the
performance condition on the date of grant. For grants of stock options, represents the aggregate grant date fair value based on the Black
Scholes model. Grant date fair value is determined for financial statement reporting purposes and the amounts shown do not reflect actual
42