Electronic Arts 2015 Annual Report Download - page 115
Download and view the complete annual report
Please find page 115 of the 2015 Electronic Arts annual report below. You can navigate through the pages in the report by either clicking on the pages listed below, or by using the keyword search tool below to find specific information within the annual report.-
 1
1 -
2
-
3
-
4
-
5
-
6
-
7
-
8
-
9
-
10
-
11
-
12
-
13
-
14
-
15
-
16
-
17
-
18
-
19
-
20
-
21
-
22
-
23
-
24
-
25
-
26
-
27
-
28
-
29
-
30
-
31
-
32
-
33
-
34
-
35
-
36
-
37
-
38
-
39
-
40
-
41
-
42
-
43
-
44
-
45
-
46
-
47
-
48
-
49
-
50
-
51
-
52
-
53
-
54
-
55
-
56
-
57
-
58
-
59
-
60
-
61
-
62
-
63
-
64
-
65
-
66
-
67
-
68
-
69
-
70
-
71
-
72
-
73
-
74
-
75
-
76
-
77
-
78
-
79
-
80
-
81
-
82
-
83
-
84
-
85
-
86
-
87
-
88
-
89
-
90
-
91
-
92
-
93
-
94
-
95
-
96
-
97
-
98
-
99
-
100
-
101
-
102
-
103
-
104
-
 105
105 -
 106
106 -
 107
107 -
 108
108 -
 109
109 -
 110
110 -
 111
111 -
 112
112 -
 113
113 -
 114
114 -
 115
115 -
 116
116 -
 117
117 -
 118
118 -
 119
119 -
 120
120 -
 121
121 -
 122
122 -
 123
123 -
 124
124 -
 125
125 -
126
-
127
-
128
-
129
-
130
-
131
-
132
-
133
-
134
-
135
-
136
-
137
-
138
-
139
-
140
-
141
-
142
-
143
-
144
-
145
-
146
-
147
-
148
-
149
-
150
-
151
-
152
-
153
-
154
-
155
-
156
-
157
-
158
-
159
-
160
-
161
-
162
-
163
-
164
-
165
-
166
-
167
-
168
-
169
-
170
-
171
-
172
-
173
-
174
-
175
-
176
-
177
-
178
-
179
-
180
 |
 |

Annual Report
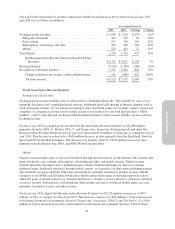
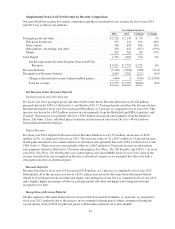
Cost of Revenue
Cost of revenue for fiscal years 2014 and 2013 was as follows (in millions):
March 31,
2014
%of
Related
Net Revenue
March 31,
2013
%of
Related Net
Revenue % Change
Change as a
% of Related
Net Revenue
Cost of revenue:
Product .............................. $1,032 48.4% $1,085 39.6% (4.9)% 8.8%
Service and other ...................... 315 21.9% 303 28.6% 4.0% (6.7)%
Total cost of revenue ................. $1,347 37.7% $1,388 36.6% (3.0)% 1.1%
Cost of Product Revenue
Cost of product revenue decreased by $53 million, or 4.9 percent in fiscal year 2014, as compared to fiscal year
2013. The decrease was primarily due to intangible impairment charges incurred in fiscal year 2013 compared to
an immaterial amount of such charges incurred during fiscal year 2014, and a decrease in royalty costs due to
fewer royalty-bearing products released during fiscal year 2014, as compared to fiscal year 2013.
Cost of Service and Other Revenue
Cost of service and other revenue increased by $12 million, or 4.0 percent in fiscal year 2014, as compared to
fiscal year 2013. The increase was primarily due to an increase in product costs due to the release of Titanfall and
an increase in royalty costs due to more royalty-bearing services released during fiscal year 2014, as compared to
fiscal year 2013.
Total Cost of Revenue as a Percentage of Total Net Revenue
Total cost of revenue as a percentage of total net revenue remained relatively consistent during fiscal year 2014
as compared to fiscal year 2013.
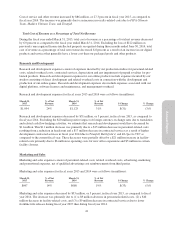
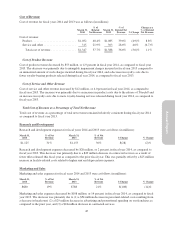
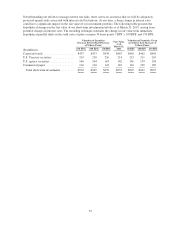
Research and Development
Research and development expenses for fiscal years 2014 and 2013 were as follows (in millions):
March 31,
2014
% of Net
Revenue
March 31,
2013
% of Net
Revenue $ Change % Change
$1,125 31% $1,153 30% $(28) (2)%
Research and development expenses decreased by $28 million, or 2 percent, in fiscal year 2014, as compared to
fiscal year 2013. This decrease was primarily due to a $49 million decrease in contracted services as a result of
fewer titles released this fiscal year as compared to the prior fiscal year. This was partially offset by a $25 million
increase in facility-related costs related to higher rent and depreciation expenses.
Marketing and Sales
Marketing and sales expenses for fiscal years 2014 and 2013 were as follows (in millions):
March 31,
2014
% of Net
Revenue
March 31,
2013
% of Net
Revenue $ Change % Change
$680 19% $788 21% $(108) (14)%
Marketing and sales expenses decreased by $108 million, or 14 percent, in fiscal year 2014, as compared to fiscal
year 2013. The decrease was primarily due to (1) a $54 million decrease in personnel-related costs resulting from
a decrease in headcount, (2) a $29 million decrease in advertising and promotional spending on our franchises as
compared to the prior year, and (3) a $24 million decrease in contracted services.
45