Electronic Arts 2015 Annual Report Download - page 32
Download and view the complete annual report
Please find page 32 of the 2015 Electronic Arts annual report below. You can navigate through the pages in the report by either clicking on the pages listed below, or by using the keyword search tool below to find specific information within the annual report.-
 1
1 -
2
-
3
-
4
-
5
-
6
-
7
-
8
-
9
-
10
-
11
-
12
-
13
-
14
-
15
-
16
-
17
-
18
-
19
-
20
-
21
-
 22
22 -
 23
23 -
 24
24 -
 25
25 -
 26
26 -
 27
27 -
 28
28 -
 29
29 -
 30
30 -
 31
31 -
 32
32 -
 33
33 -
 34
34 -
 35
35 -
 36
36 -
 37
37 -
 38
38 -
 39
39 -
 40
40 -
 41
41 -
 42
42 -
43
-
44
-
45
-
46
-
47
-
48
-
49
-
50
-
51
-
52
-
53
-
54
-
55
-
56
-
57
-
58
-
59
-
60
-
61
-
62
-
63
-
64
-
65
-
66
-
67
-
68
-
69
-
70
-
71
-
72
-
73
-
74
-
75
-
76
-
77
-
78
-
79
-
80
-
81
-
82
-
83
-
84
-
85
-
86
-
87
-
88
-
89
-
90
-
91
-
92
-
93
-
94
-
95
-
96
-
97
-
98
-
99
-
100
-
101
-
102
-
103
-
104
-
105
-
106
-
107
-
108
-
109
-
110
-
111
-
112
-
113
-
114
-
115
-
116
-
117
-
118
-
119
-
120
-
121
-
122
-
123
-
124
-
125
-
126
-
127
-
128
-
129
-
130
-
131
-
132
-
133
-
134
-
135
-
136
-
137
-
138
-
139
-
140
-
141
-
142
-
143
-
144
-
145
-
146
-
147
-
148
-
149
-
150
-
151
-
152
-
153
-
154
-
155
-
156
-
157
-
158
-
159
-
160
-
161
-
162
-
163
-
164
-
165
-
166
-
167
-
168
-
169
-
170
-
171
-
172
-
173
-
174
-
175
-
176
-
177
-
178
-
179
-
180
 |
 |

Compensation decisions made by the Board and the Compensation Committee are based on several factors,
including the Company’s financial performance, the financial and operating performance of each NEO’s business
unit (if applicable), individual performance, market trends, and other factors unique to each individual. The
impact of the Company’s financial performance and individual considerations in our fiscal 2015 compensation
decisions are detailed in the section of this CD&A entitled “Our NEOs’ Fiscal 2015 Compensation.” The
Compensation Committee and the Board also reference certain market-based considerations, such as peer group
data, benchmarking and percentiles when making compensation decisions.
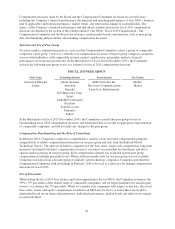
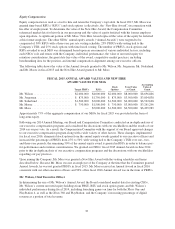
Selection and Use of Peer Group
To assess market compensation practices, each year the Compensation Committee selects a group of comparable
companies (“peer group”) to use as a reference for compensation decisions. Our peer group comprises companies
across related industries, with comparable revenue, market capitalization, geographic markets, financial
performance and expected growth rates. In the third quarter of fiscal 2014 (November 2013), the Committee
selected the following peer group to use as a reference for fiscal 2015 compensation decisions.
FISCAL 2015 PEER GROUP
Video Game Technology/Internet Entertainment Toys/Games
Activision Blizzard Adobe Systems AMC Networks Inc. Hasbro
Zynga Autodesk Discovery Communications Mattel
Expedia Lions Gate Entertainment
IAC/Interactive Corp.
Intuit
LinkedIn Corporation
Priceline
Salesforce.com
Symantec
Yahoo!
In the third quarter of fiscal 2015 (November 2014), the Committee assessed this peer group for use in
benchmarking fiscal 2016 compensation decisions and determined that it was still an appropriate representation
of comparable companies, and did not make any changes to the peer group.
Compensation Benchmarking and the Role of Consultants
In February 2014, Compensia conducted a comprehensive analysis of our executive compensation programs
using publicly available compensation information on our peer group and data from the Radford Global
Technology Survey. The analysis included a comparison of the base salary, target cash compensation, long-term
incentives and target total direct compensation of each of our senior vice-president level positions and above
against similar positions in our peer group. Each compensation element was evaluated against peer group
compensation at multiple percentile levels. Where sufficient market data for our peer group was not available,
Compensia used data from a broader group of similarly sized technology companies. Compensia provided the
Compensation Committee with its findings in February 2014 to be used as a reference for making compensation
decisions for fiscal 2015.
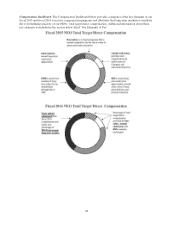
Use of Percentiles
When setting the fiscal 2015 base salaries and bonus opportunities for our NEOs, the Committee references the
50th to 75th percentiles of the market range of comparable companies, and for target guidelines for annual equity
awards, we reference the 75th percentile. While we consider each component with respect to this data, the actual
base salary, bonus, and equity compensation awarded to an NEO may be above or below these levels and is
determined based on our financial performance, individual performance, market trends and other factors unique
to each individual.
26