Electronic Arts 2015 Annual Report Download - page 118
Download and view the complete annual report
Please find page 118 of the 2015 Electronic Arts annual report below. You can navigate through the pages in the report by either clicking on the pages listed below, or by using the keyword search tool below to find specific information within the annual report.-
 1
1 -
2
-
3
-
4
-
5
-
6
-
7
-
8
-
9
-
10
-
11
-
12
-
13
-
14
-
15
-
16
-
17
-
18
-
19
-
20
-
21
-
22
-
23
-
24
-
25
-
26
-
27
-
28
-
29
-
30
-
31
-
32
-
33
-
34
-
35
-
36
-
37
-
38
-
39
-
40
-
41
-
42
-
43
-
44
-
45
-
46
-
47
-
48
-
49
-
50
-
51
-
52
-
53
-
54
-
55
-
56
-
57
-
58
-
59
-
60
-
61
-
62
-
63
-
64
-
65
-
66
-
67
-
68
-
69
-
70
-
71
-
72
-
73
-
74
-
75
-
76
-
77
-
78
-
79
-
80
-
81
-
82
-
83
-
84
-
85
-
86
-
87
-
88
-
89
-
90
-
91
-
92
-
93
-
94
-
95
-
96
-
97
-
98
-
99
-
100
-
101
-
102
-
103
-
104
-
105
-
106
-
107
-
 108
108 -
 109
109 -
 110
110 -
 111
111 -
 112
112 -
 113
113 -
 114
114 -
 115
115 -
 116
116 -
 117
117 -
 118
118 -
 119
119 -
 120
120 -
 121
121 -
 122
122 -
 123
123 -
 124
124 -
 125
125 -
 126
126 -
 127
127 -
 128
128 -
129
-
130
-
131
-
132
-
133
-
134
-
135
-
136
-
137
-
138
-
139
-
140
-
141
-
142
-
143
-
144
-
145
-
146
-
147
-
148
-
149
-
150
-
151
-
152
-
153
-
154
-
155
-
156
-
157
-
158
-
159
-
160
-
161
-
162
-
163
-
164
-
165
-
166
-
167
-
168
-
169
-
170
-
171
-
172
-
173
-
174
-
175
-
176
-
177
-
178
-
179
-
180
 |
 |

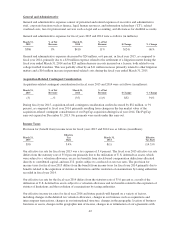
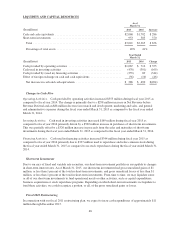
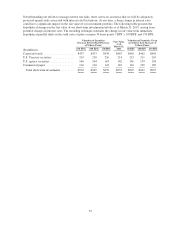
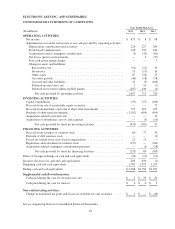
LIQUIDITY AND CAPITAL RESOURCES
As of
March 31,
Increase(In millions) 2015 2014
Cash and cash equivalents ............................................. $2,068 $1,782 $ 286
Short-term investments ............................................... 953 583 370
Total ............................................................ $3,021 $2,365 $ 656
Percentage of total assets ............................................ 49% 41%
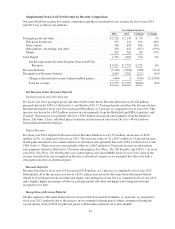
Year Ended
March 31,
Change(In millions) 2015 2014
Cash provided by operating activities .................................... $1,067 $ 712 $ 355
Cash used in investing activities ........................................ (470) (301) (169)
Cash provided by (used in) financing activities ............................. (255) 89 (344)
Effect of foreign exchange on cash and cash equivalents ..................... (56) (10) (46)
Net increase in cash and cash equivalents ............................... $ 286 $ 490 $(204)
Changes in Cash Flow
Operating Activities. Cash provided by operating activities increased $355 million during fiscal year 2015 as
compared to fiscal year 2014. The change is primarily due to a $298 million increase in Net Revenue before
Revenue Deferral and an $88 million decrease in research and development, marketing and sales, and general
and administrative expenses during the fiscal year ended March 31, 2015 as compared to the fiscal year ended
March 31, 2014.
Investing Activities. Cash used in investing activities increased $169 million during fiscal year 2015 as
compared to fiscal year 2014 primarily driven by a $502 million increase in purchases of short-term investments.
This was partially offset by a $326 million increase in proceeds from the sales and maturities of short-term
investments during the fiscal year ended March 31, 2015 as compared to the fiscal year ended March 31, 2014.
Financing Activities. Cash used in financing activities increased $344 million during fiscal year 2015 as
compared to fiscal year 2014 primarily due to $337 million used to repurchase and retire common stock during
the fiscal year ended March 31, 2015 as compared to no stock repurchases during the fiscal year ended March 31,
2014.
Short-term Investments
Due to our mix of fixed and variable rate securities, our short-term investment portfolio is susceptible to changes
in short-term interest rates. As of March 31, 2015, our short-term investments had gross unrealized gains of $1
million, or less than 1 percent of the total in short-term investments, and gross unrealized losses of less than $1
million, or less than 1 percent of the total in short-term investments. From time to time, we may liquidate some
or all of our short-term investments to fund operational needs or other activities, such as capital expenditures,
business acquisitions or stock repurchase programs. Depending on which short-term investments we liquidate to
fund these activities, we could recognize a portion, or all, of the gross unrealized gains or losses.
Fiscal 2011 Restructuring
In connection with our fiscal 2011 restructuring plan, we expect to incur cash expenditures of approximately $11
million through December 2015.
48