Electronic Arts 2015 Annual Report Download - page 164
Download and view the complete annual report
Please find page 164 of the 2015 Electronic Arts annual report below. You can navigate through the pages in the report by either clicking on the pages listed below, or by using the keyword search tool below to find specific information within the annual report.-
 1
1 -
2
-
3
-
4
-
5
-
6
-
7
-
8
-
9
-
10
-
11
-
12
-
13
-
14
-
15
-
16
-
17
-
18
-
19
-
20
-
21
-
22
-
23
-
24
-
25
-
26
-
27
-
28
-
29
-
30
-
31
-
32
-
33
-
34
-
35
-
36
-
37
-
38
-
39
-
40
-
41
-
42
-
43
-
44
-
45
-
46
-
47
-
48
-
49
-
50
-
51
-
52
-
53
-
54
-
55
-
56
-
57
-
58
-
59
-
60
-
61
-
62
-
63
-
64
-
65
-
66
-
67
-
68
-
69
-
70
-
71
-
72
-
73
-
74
-
75
-
76
-
77
-
78
-
79
-
80
-
81
-
82
-
83
-
84
-
85
-
86
-
87
-
88
-
89
-
90
-
91
-
92
-
93
-
94
-
95
-
96
-
97
-
98
-
99
-
100
-
101
-
102
-
103
-
104
-
105
-
106
-
107
-
108
-
109
-
110
-
111
-
112
-
113
-
114
-
115
-
116
-
117
-
118
-
119
-
120
-
121
-
122
-
123
-
124
-
125
-
126
-
127
-
128
-
129
-
130
-
131
-
132
-
133
-
134
-
135
-
136
-
137
-
138
-
139
-
140
-
141
-
142
-
143
-
144
-
145
-
146
-
147
-
148
-
149
-
150
-
151
-
152
-
153
-
 154
154 -
 155
155 -
 156
156 -
 157
157 -
 158
158 -
 159
159 -
 160
160 -
 161
161 -
 162
162 -
 163
163 -
 164
164 -
 165
165 -
 166
166 -
 167
167 -
 168
168 -
 169
169 -
 170
170 -
 171
171 -
 172
172 -
 173
173 -
 174
174 -
175
-
176
-
177
-
178
-
179
-
180
 |
 |

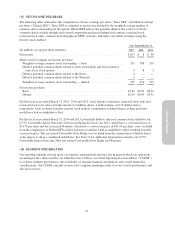
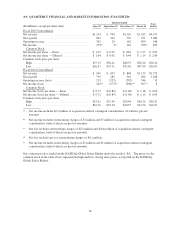
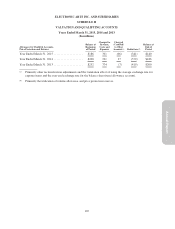
The following table summarizes the financial performance of our current segment operating profit and a
reconciliation to our consolidated operating income for the fiscal years ended March 31, 2015, 2014 and 2013 (in
millions):
Year Ended March 31,
2015 2014 2013
Segment:
Net revenue before revenue deferral ................................... $4,319 $ 4,021 $ 3,793
Depreciation ...................................................... (126) (126) (118)
Other expenses .................................................... (3,117) (3,178) (3,308)
Segment operating profit ............................................ 1,076 717 367
Reconciliation to consolidated operating income:
Other:
Revenue deferral .................................................. (3,536) (3,350) (3,022)
Recognition of revenue deferral ....................................... 3,732 2,904 3,026
Amortization of intangibles .......................................... (66) (76) (123)
Acquisition-related contingent consideration ............................ 3 35 64
Restructuring and other charges ....................................... — 1 (27)
Stock-based compensation ........................................... (144) (150) (164)
Loss on licensed intellectual property commitment ....................... (122) — —
Other expenses .................................................... 5 (48) —
Consolidated operating income ......................................... $ 948 $ 33 $ 121
Our segment profit differs from consolidated operating income primarily due to the exclusion of (1) the deferral
of net revenue related to online-enabled games (see Note 10 for additional information regarding deferred net
revenue (online-enabled games)), (2) certain non-cash costs such as stock-based compensation, (3) acquisition-
related expenses such as amortization of intangibles and acquisition-related contingent consideration, and
(4) other significant non-recurring costs that may not be indicative of the company’s core business, operating
results or future outlook. Our CODM reviews assets on a consolidated basis and not on a segment basis.
Information about our total net revenue by revenue composition and by platform for the fiscal years ended
March 31, 2015, 2014 and 2013 is presented below (in millions):
Year Ended March 31,
2015 2014 2013
Packaged goods and other ............................................... $2,316 $1,742 $2,357
Digital ............................................................... 2,199 1,833 1,440
Net revenue ........................................................ $4,515 $3,575 $3,797
Year Ended March 31,
2015 2014 2013
Platform net revenue
Xbox One, PlayStation 4 .............................................. $1,505 $ 196 $ —
Xbox 360, PlayStation 3 ............................................... 1,485 1,779 2,262
Other consoles ...................................................... 21 30 63
Total consoles ..................................................... 3,011 2,005 2,325
PC / Browser ....................................................... 878 1,020 928
Mobile ............................................................ 504 400 339
Other .............................................................. 122 150 205
Net revenue ...................................................... $4,515 $3,575 $3,797
94