Electronic Arts 2015 Annual Report Download - page 109
Download and view the complete annual report
Please find page 109 of the 2015 Electronic Arts annual report below. You can navigate through the pages in the report by either clicking on the pages listed below, or by using the keyword search tool below to find specific information within the annual report.-
 1
1 -
2
-
3
-
4
-
5
-
6
-
7
-
8
-
9
-
10
-
11
-
12
-
13
-
14
-
15
-
16
-
17
-
18
-
19
-
20
-
21
-
22
-
23
-
24
-
25
-
26
-
27
-
28
-
29
-
30
-
31
-
32
-
33
-
34
-
35
-
36
-
37
-
38
-
39
-
40
-
41
-
42
-
43
-
44
-
45
-
46
-
47
-
48
-
49
-
50
-
51
-
52
-
53
-
54
-
55
-
56
-
57
-
58
-
59
-
60
-
61
-
62
-
63
-
64
-
65
-
66
-
67
-
68
-
69
-
70
-
71
-
72
-
73
-
74
-
75
-
76
-
77
-
78
-
79
-
80
-
81
-
82
-
83
-
84
-
85
-
86
-
87
-
88
-
89
-
90
-
91
-
92
-
93
-
94
-
95
-
96
-
97
-
98
-
 99
99 -
 100
100 -
 101
101 -
 102
102 -
 103
103 -
 104
104 -
 105
105 -
 106
106 -
 107
107 -
 108
108 -
 109
109 -
 110
110 -
 111
111 -
 112
112 -
 113
113 -
 114
114 -
 115
115 -
 116
116 -
 117
117 -
 118
118 -
 119
119 -
120
-
121
-
122
-
123
-
124
-
125
-
126
-
127
-
128
-
129
-
130
-
131
-
132
-
133
-
134
-
135
-
136
-
137
-
138
-
139
-
140
-
141
-
142
-
143
-
144
-
145
-
146
-
147
-
148
-
149
-
150
-
151
-
152
-
153
-
154
-
155
-
156
-
157
-
158
-
159
-
160
-
161
-
162
-
163
-
164
-
165
-
166
-
167
-
168
-
169
-
170
-
171
-
172
-
173
-
174
-
175
-
176
-
177
-
178
-
179
-
180
 |
 |

Annual Report
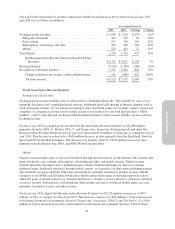
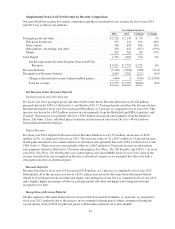
Our non-GAAP net revenue by revenue composition and the reconciliation to net revenue for fiscal years 2015
and 2014 was as follows (in millions):
Year Ended March 31,
2015 2014 $ Change % Change
Packaged goods and other .................................... $2,089 $ 2,228 $(139) (6)%
Full-game downloads ..................................... 419 323 96 30%
Extra content ............................................ 925 760 165 22%
Subscriptions, advertising, and other ......................... 362 258 104 40%
Mobile ................................................. 524 452 72 16%
Total Digital .............................................. 2,230 1,793 437 24%
Net Revenue before Revenue Deferral (Non-GAAP Net
Revenue) ........................................... $4,319 $ 4,021 $ 298 7%
Revenue Deferral .......................................... (3,536) (3,350) (186) (6)%
Recognition of Revenue Deferral .............................. 3,732 2,904 828 29%
Change in deferred net revenue (online-enabled games) ........ 196 (446) 642 144%
Total net revenue ....................................... $4,515 $ 3,575 $ 940 26%
Net Revenue before Revenue Deferral
Packaged goods and other
Packaged goods revenue includes sales of software that is distributed physically. This includes (1) sales of our
internally-developed and co-published game software distributed physically through traditional channels such as
brick and mortar retailers, (2) our software licensing revenue from third parties (for example, makers of personal
computers or computer accessories) who include certain of our products for sale with their products (“OEM
bundles”), and (3) sales through our Switzerland distribution business. Other revenue includes our non-software
licensing revenue.
For fiscal year 2015, packaged goods and other Net Revenue before Revenue Deferral was $2,089 million,
primarily driven by FIFA 15,Madden NFL 15, and Dragon Age: Inquisition. Packaged goods and other Net
Revenue before Revenue Deferral for fiscal year 2015 decreased $139 million, or 6 percent, as compared to fiscal
year 2014. This decrease was driven by a $650 million decrease in sales primarily from the Battlefield, Need for
Speed and NCAA Football franchises.This decrease was partially offset by a $511 million increase in sales
primarily from the Dragon Age, FIFA, and FIFA World Cup franchises.
Digital
Digital revenue includes sales of software distributed through direct download via the Internet. This includes full-
game downloads, extra content, subscriptions, advertising and other, and mobile revenue. Digital revenue
includes internally-developed and co-published game software distributed through our direct-to-consumer
platform Origin, distributed wirelessly through mobile carriers, or licensed to our third-party publishing partners
who distribute our games digitally. Full-game downloads are generally classified as product revenue with the
exception of our MMO and full-game downloads related to games that require our hosting support in order to
utilize the game or related content (e.g. Titanfall and Plants vs. Zombies: Garden Warfare), which are classified
as service revenue. Subscriptions, advertising and other revenue and free-to-download mobile games are each
generally classified as service and other revenue.
For fiscal year 2015, digital Net Revenue before Revenue Deferral was $2,230 million, an increase of $437
million, or 24%, as compared to fiscal year 2014. This increase is due to (1) a $96 million or 30 percent increase
in full-game download sales primarily driven by Dragon Age: Inquisition,FIFA 15 and The Sims 4, (2) a $165
million or 22 percent increase in extra content and free-to-download sales primarily driven by FIFA Ultimate
39