Electronic Arts 2015 Annual Report Download - page 99
Download and view the complete annual report
Please find page 99 of the 2015 Electronic Arts annual report below. You can navigate through the pages in the report by either clicking on the pages listed below, or by using the keyword search tool below to find specific information within the annual report.-
 1
1 -
2
-
3
-
4
-
5
-
6
-
7
-
8
-
9
-
10
-
11
-
12
-
13
-
14
-
15
-
16
-
17
-
18
-
19
-
20
-
21
-
22
-
23
-
24
-
25
-
26
-
27
-
28
-
29
-
30
-
31
-
32
-
33
-
34
-
35
-
36
-
37
-
38
-
39
-
40
-
41
-
42
-
43
-
44
-
45
-
46
-
47
-
48
-
49
-
50
-
51
-
52
-
53
-
54
-
55
-
56
-
57
-
58
-
59
-
60
-
61
-
62
-
63
-
64
-
65
-
66
-
67
-
68
-
69
-
70
-
71
-
72
-
73
-
74
-
75
-
76
-
77
-
78
-
79
-
80
-
81
-
82
-
83
-
84
-
85
-
86
-
87
-
88
-
 89
89 -
 90
90 -
 91
91 -
 92
92 -
 93
93 -
 94
94 -
 95
95 -
 96
96 -
 97
97 -
 98
98 -
 99
99 -
 100
100 -
 101
101 -
 102
102 -
 103
103 -
 104
104 -
 105
105 -
 106
106 -
 107
107 -
 108
108 -
 109
109 -
110
-
111
-
112
-
113
-
114
-
115
-
116
-
117
-
118
-
119
-
120
-
121
-
122
-
123
-
124
-
125
-
126
-
127
-
128
-
129
-
130
-
131
-
132
-
133
-
134
-
135
-
136
-
137
-
138
-
139
-
140
-
141
-
142
-
143
-
144
-
145
-
146
-
147
-
148
-
149
-
150
-
151
-
152
-
153
-
154
-
155
-
156
-
157
-
158
-
159
-
160
-
161
-
162
-
163
-
164
-
165
-
166
-
167
-
168
-
169
-
170
-
171
-
172
-
173
-
174
-
175
-
176
-
177
-
178
-
179
-
180
 |
 |

Annual Report
We track an estimate of monthly active users (“MAUs”) for our mobile business, which we believe is a useful
indicator of player engagement trends for that business. For the fiscal year ended March 31, 2015, we had
average MAUs of over 165 million. MAUs are the aggregate number of individuals who accessed a particular
game on a particular device in the last 30 days as of the measurement date. For our calculation, an individual who
either plays two of our games on a single device, or the same game on two devices in the relevant period, would
be counted as two users. Average MAUs for a particular period is the average of the MAUs at each month-end
during that period. MAUs are calculated using internal company data based on tracking the activity of user
accounts. We also include in this calculation data provided by our third party publishing partners for certain
games that we develop but we exclude information from third party titles that we publish. From time to time, we
adjust the calculation for user activity that is inconsistent with our methodology. We believe that the numbers are
reasonable estimates of our user base for the applicable period of measurement; however, factors relating to user
activity may impact these numbers. Our methodology for calculating MAUs may differ from the methodology
used by other companies to calculate this metric.
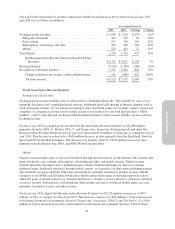
Concentration of Sales Among the Most Popular Games. In all major segments of our industry, we see a large
portion of games sales concentrated on the most popular titles, and many of those titles are sequels of prior
games. A significant portion of our revenue has historically been derived from games and services based on a
few popular franchises. For example, in fiscal year 2015, net revenue generated from the sale of products and
services associated with our three largest franchises accounted for approximately 54% of our net revenue. We
expect this trend to continue in fiscal year 2016.
Recent Developments
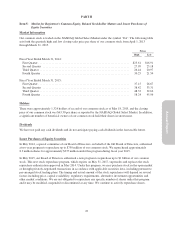
Stock Repurchase Program. In May 2015, our Board of Directors authorized a new program to repurchase up
to $1 billion of our common stock. This new stock repurchase program, which expires on May 31, 2017,
supersedes and replaces the stock repurchase authorization approved in May 2014 under which we repurchased
approximately 8.3 million shares for approximately $337 million during fiscal year 2015. Under the new
program, we may purchase stock in the open market or through privately-negotiated transactions in accordance
with applicable securities laws, including pursuant to pre-arranged stock trading plans. The timing and actual
amount of the stock repurchases will depend on several factors including price, capital availability, regulatory
requirements, alternative investment opportunities and other market conditions. We are not obligated to
repurchase any specific number of shares under this program and it may be modified, suspended or discontinued
at any time. We continue to actively repurchase shares.
CRITICAL ACCOUNTING POLICIES AND ESTIMATES
Our Consolidated Financial Statements have been prepared in accordance with accounting principles generally
accepted in the United States (“U.S. GAAP”). The preparation of these Consolidated Financial Statements
requires management to make estimates and assumptions that affect the reported amounts of assets and liabilities,
contingent assets and liabilities, and revenue and expenses during the reporting periods. The policies discussed
below are considered by management to be critical because they are not only important to the portrayal of our
financial condition and results of operations, but also because application and interpretation of these policies
requires both management judgment and estimates of matters that are inherently uncertain and unknown. As a
result, actual results may differ materially from our estimates.
Revenue Recognition, Sales Returns and Allowances, and Bad Debt Reserves
We derive revenue principally from sales of interactive software games, and related content (e.g., micro-
transactions) and services on (1) video game consoles (such as the PlayStation 3 and 4 from Sony, and the Xbox
360 and Xbox One from Microsoft) and PCs, and (2) mobile phones and tablets. We evaluate revenue
recognition based on the criteria set forth in FASB Accounting Standards Codification (“ASC”) 605, Revenue
Recognition and ASC 985-605, Software: Revenue Recognition. We classify our revenue as either product
revenue or service and other revenue.
29