Electronic Arts 2015 Annual Report Download - page 30
Download and view the complete annual report
Please find page 30 of the 2015 Electronic Arts annual report below. You can navigate through the pages in the report by either clicking on the pages listed below, or by using the keyword search tool below to find specific information within the annual report.-
 1
1 -
2
-
3
-
4
-
5
-
6
-
7
-
8
-
9
-
10
-
11
-
12
-
13
-
14
-
15
-
16
-
17
-
18
-
19
-
 20
20 -
 21
21 -
 22
22 -
 23
23 -
 24
24 -
 25
25 -
 26
26 -
 27
27 -
 28
28 -
 29
29 -
 30
30 -
 31
31 -
 32
32 -
 33
33 -
 34
34 -
 35
35 -
 36
36 -
 37
37 -
 38
38 -
 39
39 -
 40
40 -
41
-
42
-
43
-
44
-
45
-
46
-
47
-
48
-
49
-
50
-
51
-
52
-
53
-
54
-
55
-
56
-
57
-
58
-
59
-
60
-
61
-
62
-
63
-
64
-
65
-
66
-
67
-
68
-
69
-
70
-
71
-
72
-
73
-
74
-
75
-
76
-
77
-
78
-
79
-
80
-
81
-
82
-
83
-
84
-
85
-
86
-
87
-
88
-
89
-
90
-
91
-
92
-
93
-
94
-
95
-
96
-
97
-
98
-
99
-
100
-
101
-
102
-
103
-
104
-
105
-
106
-
107
-
108
-
109
-
110
-
111
-
112
-
113
-
114
-
115
-
116
-
117
-
118
-
119
-
120
-
121
-
122
-
123
-
124
-
125
-
126
-
127
-
128
-
129
-
130
-
131
-
132
-
133
-
134
-
135
-
136
-
137
-
138
-
139
-
140
-
141
-
142
-
143
-
144
-
145
-
146
-
147
-
148
-
149
-
150
-
151
-
152
-
153
-
154
-
155
-
156
-
157
-
158
-
159
-
160
-
161
-
162
-
163
-
164
-
165
-
166
-
167
-
168
-
169
-
170
-
171
-
172
-
173
-
174
-
175
-
176
-
177
-
178
-
179
-
180
 |
 |
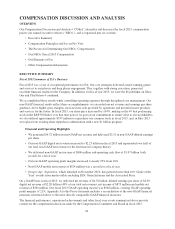
COMPENSATION DISCUSSION AND ANALYSIS
OVERVIEW
Our Compensation Discussion and Analysis (“CD&A”) describes and discusses the fiscal 2015 compensation
paid to our named executive officers (“NEOs”), and is organized into six sections:
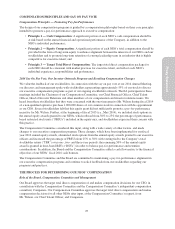
• Executive Summary
• Compensation Principles and Say on Pay Vote
• The Process for Determining Our NEOs’ Compensation
• Our NEOs’ Fiscal 2015 Compensation
• Our Elements of Pay
• Other Compensation Information
EXECUTIVE SUMMARY
Fiscal 2015 Summary of EA’s Business
Fiscal 2015 was a year of exceptional performance for EA. Our core strategies delivered award-winning games
and services to our players and deep player engagement. This, together with strong execution, generated
excellent financial results for the Company. In addition, for fiscal year 2015, we were the #1 publisher on Xbox
One and PlayStation 4 combined.
We accomplished these results while controlling operating expenses through disciplined cost management. Our
non-GAAP financial results reflect these accomplishments: we exceeded our net revenue and earnings per share
guidance, drove higher gross margins, increased our cash provided by operations and invested in new products
and services for the future. In fiscal 2015, our share price increased by 104%, making us the 4th best performing
stock in the S&P 500 Index over that time period. As part of our commitment to return value to our stockholders,
we also utilized approximately $337 million to repurchase our common stock in fiscal 2015, and, in May 2015
we replaced our existing share repurchase authorization with a new $1 billion program.
Financial and Operating Highlights
• We generated $4.32 billion in non-GAAP net revenue and delivered $2.51 in non-GAAP diluted earnings
per share.
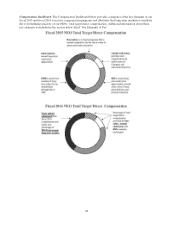
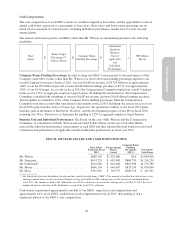
• Our non-GAAP digital net revenue increased to $2.23 billion in fiscal 2015 and represented over half of
our total non-GAAP net revenue for the first time in Company history.
• We delivered non-GAAP net income of $806 million and operating cash flow of $1.07 billion, both
records for a fiscal year.
• Our non-GAAP operating profit margins increased to nearly 25% from 18%.
• Non-GAAP mobile net revenue of $524 million was a record for a fiscal year.
•Dragon Age: Inquisition, which launched in November 2014, has garnered more than 100 “Game of the
Year” awards from media outlets including IGN, Game Informer and the Associated Press.
On a GAAP basis in fiscal 2015, we delivered net revenue of $4.52 billion, diluted earnings per share of $2.69,
digital net revenue of $2.20 billion (49% of our total net revenue), net income of $875 million and mobile net
revenue of $501 million. Our fiscal 2015 GAAP operating income was $948 million, creating GAAP operating
profit margins of 21%. Appendix A to this Proxy statement includes a reconciliation of the non-GAAP financial
measures referenced above to the most directly comparable GAAP financial measures.
The financial performance, operational achievements and other fiscal year events summarized above provide
context for the compensation decisions made by the Compensation Committee and Board in fiscal 2015.
24