Electronic Arts 2015 Annual Report Download - page 108
Download and view the complete annual report
Please find page 108 of the 2015 Electronic Arts annual report below. You can navigate through the pages in the report by either clicking on the pages listed below, or by using the keyword search tool below to find specific information within the annual report.-
 1
1 -
2
-
3
-
4
-
5
-
6
-
7
-
8
-
9
-
10
-
11
-
12
-
13
-
14
-
15
-
16
-
17
-
18
-
19
-
20
-
21
-
22
-
23
-
24
-
25
-
26
-
27
-
28
-
29
-
30
-
31
-
32
-
33
-
34
-
35
-
36
-
37
-
38
-
39
-
40
-
41
-
42
-
43
-
44
-
45
-
46
-
47
-
48
-
49
-
50
-
51
-
52
-
53
-
54
-
55
-
56
-
57
-
58
-
59
-
60
-
61
-
62
-
63
-
64
-
65
-
66
-
67
-
68
-
69
-
70
-
71
-
72
-
73
-
74
-
75
-
76
-
77
-
78
-
79
-
80
-
81
-
82
-
83
-
84
-
85
-
86
-
87
-
88
-
89
-
90
-
91
-
92
-
93
-
94
-
95
-
96
-
97
-
 98
98 -
 99
99 -
 100
100 -
 101
101 -
 102
102 -
 103
103 -
 104
104 -
 105
105 -
 106
106 -
 107
107 -
 108
108 -
 109
109 -
 110
110 -
 111
111 -
 112
112 -
 113
113 -
 114
114 -
 115
115 -
 116
116 -
 117
117 -
 118
118 -
119
-
120
-
121
-
122
-
123
-
124
-
125
-
126
-
127
-
128
-
129
-
130
-
131
-
132
-
133
-
134
-
135
-
136
-
137
-
138
-
139
-
140
-
141
-
142
-
143
-
144
-
145
-
146
-
147
-
148
-
149
-
150
-
151
-
152
-
153
-
154
-
155
-
156
-
157
-
158
-
159
-
160
-
161
-
162
-
163
-
164
-
165
-
166
-
167
-
168
-
169
-
170
-
171
-
172
-
173
-
174
-
175
-
176
-
177
-
178
-
179
-
180
 |
 |
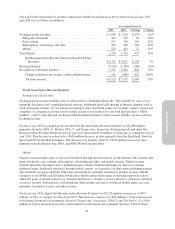
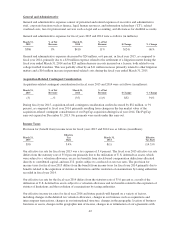
Product Revenue
For fiscal year 2015, product revenue was $2,568 million, primarily driven by FIFA 15,FIFA 14 and
Battlefield 4. Product revenue increased $434 million, or 20 percent, as compared to fiscal year 2014. This
increase was driven by an $837 million increase primarily from the FIFA, Madden NFL and Dragon Age
franchises. This increase was partially offset by a $403 million decrease primarily from the Crysis, Dead Space,
NCAA Football, Tiger Woods PGA Tour and Army of Two franchises.
Service and Other Revenue
For fiscal year 2015, service and other revenue was $1,947 million, primarily driven by FIFA Ultimate Team,
Titanfall, and Battlefield 4 Premium. Service and other revenue for fiscal year 2015 increased $506 million, or 35
percent, as compared to fiscal year 2014. This increase was driven by a $660 million increase primarily from
Titanfall and the FIFA and Plants vs Zombies franchises. This increase was partially offset by a $154 million
decrease primarily from SimCity franchise, Star Wars: The Old Republic, and Pogo-branded online games
services.
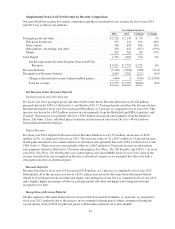
Supplemental Non-GAAP Net Revenue by Revenue Composition
As we continue to evolve our business and more of our products are delivered to consumers digitally via the
Internet, we place a greater emphasis and focus on assessing our business through a review of net revenue by
revenue composition.
Net Revenue before Revenue Deferral, a non-GAAP financial measure that excludes the impact of Revenue
Deferral and the Recognition of Revenue Deferral on Net Revenue related to sales of online-enabled games and
content, is provided in this section of MD&A, including a discussion of the components of this measure:
(1) packaged goods and other and (2) the components that comprise our digital revenue. A reconciliation to the
corresponding measure calculated in accordance with U.S. GAAP is provided in the discussion below.
“Revenue Deferral” in this “Net Revenue” section generally relates to sales of online-enabled games and content
for which we do not have VSOE for unspecified updates to be delivered after the initial sale or for which we have
a continuing service obligation. Fluctuations in the Revenue Deferral are largely dependent upon the amounts of
products that we sell with the online features and services previously discussed, while the Recognition of
Revenue Deferral for a period is also dependent upon (1) the amount deferred, (2) the period of time the
software-related offerings and service obligations are to be provided, and (3) the timing of the sale.
Our sales are generally deferred and recognized over an estimated nine-month period beginning in the month
after shipment for physical games sold through retail and an estimated six-month period for digitally delivered
games and content, and therefore, the related revenue recognized during the fiscal quarter ended March 31 is
primarily due to sales that occurred during the preceding six-month period for digitally delivered games and
content, and the preceding nine-month period for physical games sold through retail. Consequently, most
Revenue Deferrals incurred in the first quarter of a fiscal year are recognized within the same fiscal year;
however, substantially all of the Revenue Deferrals incurred in the last month of a fiscal year will be recognized
in the subsequent fiscal year.
We believe that excluding the impact of Revenue Deferral and the Recognition of Revenue Deferral related to
online-enabled games and content from our operating results is important to facilitate comparisons between
periods in understanding our underlying sales performance for the period, and understanding our operations
because all related costs of revenues are expensed as incurred instead of deferred and recognized ratably. We use
this non-GAAP financial measure internally to evaluate our operating performance, when planning, forecasting
and analyzing future periods, and when assessing the performance of our management team. While we believe
that this non-GAAP financial measure is useful in evaluating our business, this information should be considered
as supplemental in nature and is not meant to be considered in isolation from or as a substitute for the related
financial information prepared in accordance with GAAP. In addition, this non-GAAP financial measure may not
be the same as non-GAAP financial measures presented by other companies.
38