Electronic Arts 2015 Annual Report Download - page 128
Download and view the complete annual report
Please find page 128 of the 2015 Electronic Arts annual report below. You can navigate through the pages in the report by either clicking on the pages listed below, or by using the keyword search tool below to find specific information within the annual report.-
 1
1 -
2
-
3
-
4
-
5
-
6
-
7
-
8
-
9
-
10
-
11
-
12
-
13
-
14
-
15
-
16
-
17
-
18
-
19
-
20
-
21
-
22
-
23
-
24
-
25
-
26
-
27
-
28
-
29
-
30
-
31
-
32
-
33
-
34
-
35
-
36
-
37
-
38
-
39
-
40
-
41
-
42
-
43
-
44
-
45
-
46
-
47
-
48
-
49
-
50
-
51
-
52
-
53
-
54
-
55
-
56
-
57
-
58
-
59
-
60
-
61
-
62
-
63
-
64
-
65
-
66
-
67
-
68
-
69
-
70
-
71
-
72
-
73
-
74
-
75
-
76
-
77
-
78
-
79
-
80
-
81
-
82
-
83
-
84
-
85
-
86
-
87
-
88
-
89
-
90
-
91
-
92
-
93
-
94
-
95
-
96
-
97
-
98
-
99
-
100
-
101
-
102
-
103
-
104
-
105
-
106
-
107
-
108
-
109
-
110
-
111
-
112
-
113
-
114
-
115
-
116
-
117
-
 118
118 -
 119
119 -
 120
120 -
 121
121 -
 122
122 -
 123
123 -
 124
124 -
 125
125 -
 126
126 -
 127
127 -
 128
128 -
 129
129 -
 130
130 -
 131
131 -
 132
132 -
 133
133 -
 134
134 -
 135
135 -
 136
136 -
 137
137 -
 138
138 -
139
-
140
-
141
-
142
-
143
-
144
-
145
-
146
-
147
-
148
-
149
-
150
-
151
-
152
-
153
-
154
-
155
-
156
-
157
-
158
-
159
-
160
-
161
-
162
-
163
-
164
-
165
-
166
-
167
-
168
-
169
-
170
-
171
-
172
-
173
-
174
-
175
-
176
-
177
-
178
-
179
-
180
 |
 |

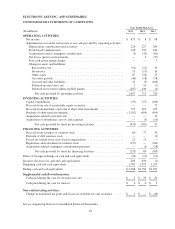
ELECTRONIC ARTS INC. AND SUBSIDIARIES
CONSOLIDATED STATEMENTS OF CASH FLOWS
Year Ended March 31,
(In millions) 2015 2014 2013
OPERATING ACTIVITIES
Net income ........................................................ $ 875 $ 8 $ 98
Adjustments to reconcile net income to net cash provided by operating activities:
Depreciation, amortization and accretion ............................... 220 227 264
Stock-based compensation .......................................... 144 150 164
Acquisition-related contingent consideration ............................ (3) (35) (64)
Net losses (gains) on investments ..................................... — 2 (37)
Non-cash restructuring charges ...................................... — — 7
Change in assets and liabilities:
Receivables, net ................................................ (54) (12) 56
Inventories ..................................................... 19 (13) 16
Other assets .................................................... 87 (56) 15
Accounts payable ............................................... (46) (18) (78)
Accrued and other liabilities ....................................... 31 (3) (106)
Deferred income taxes, net ........................................ 1 16 (7)
Deferred net revenue (online-enabled games) ......................... (207) 446 (4)
Net cash provided by operating activities ........................... 1,067 712 324
INVESTING ACTIVITIES
Capital expenditures ................................................. (95) (97) (106)
Proceeds from sale of marketable equity securities ......................... — — 72
Proceeds from maturities and sales of short-term investments ................ 727 401 459
Purchase of short-term investments ..................................... (1,102) (600) (414)
Acquisition-related restricted cash ...................................... — — 31
Acquisition of subsidiaries, net of cash acquired ........................... — (5) (10)
Net cash provided by (used in) investing activities ................... (470) (301) 32
FINANCING ACTIVITIES
Proceeds from issuance of common stock ................................ 60 77 34
Payment of debt issuance costs ......................................... — — (2)
Excess tax benefit from stock-based compensation ......................... 22 13 —
Repurchase and retirement of common stock .............................. (337) — (349)
Acquisition-related contingent consideration payment ...................... — (1) (28)
Net cash provided by (used in) financing activities ................... (255) 89 (345)
Effect of foreign exchange on cash and cash equivalents ...................... (56) (10) (12)
Increase (decrease) in cash and cash equivalents ............................. 286 490 (1)
Beginning cash and cash equivalents ...................................... 1,782 1,292 1,293
Ending cash and cash equivalents ......................................... $2,068 $1,782 $1,292
Supplemental cash flow information:
Cash paid during the year for income taxes, net ............................ $ 2 $ 29 $ 26
Cash paid during the year for interest .................................... $ 6 $ 6 $ 5
Non-cash investing activities:
Change in unrealized net gains and losses on available-for-sale securities ....... $ 1 $ — $ (46)
See accompanying Notes to Consolidated Financial Statements.
58