Electronic Arts 2015 Annual Report Download - page 114
Download and view the complete annual report
Please find page 114 of the 2015 Electronic Arts annual report below. You can navigate through the pages in the report by either clicking on the pages listed below, or by using the keyword search tool below to find specific information within the annual report.-
 1
1 -
2
-
3
-
4
-
5
-
6
-
7
-
8
-
9
-
10
-
11
-
12
-
13
-
14
-
15
-
16
-
17
-
18
-
19
-
20
-
21
-
22
-
23
-
24
-
25
-
26
-
27
-
28
-
29
-
30
-
31
-
32
-
33
-
34
-
35
-
36
-
37
-
38
-
39
-
40
-
41
-
42
-
43
-
44
-
45
-
46
-
47
-
48
-
49
-
50
-
51
-
52
-
53
-
54
-
55
-
56
-
57
-
58
-
59
-
60
-
61
-
62
-
63
-
64
-
65
-
66
-
67
-
68
-
69
-
70
-
71
-
72
-
73
-
74
-
75
-
76
-
77
-
78
-
79
-
80
-
81
-
82
-
83
-
84
-
85
-
86
-
87
-
88
-
89
-
90
-
91
-
92
-
93
-
94
-
95
-
96
-
97
-
98
-
99
-
100
-
101
-
102
-
103
-
 104
104 -
 105
105 -
 106
106 -
 107
107 -
 108
108 -
 109
109 -
 110
110 -
 111
111 -
 112
112 -
 113
113 -
 114
114 -
 115
115 -
 116
116 -
 117
117 -
 118
118 -
 119
119 -
 120
120 -
 121
121 -
 122
122 -
 123
123 -
 124
124 -
125
-
126
-
127
-
128
-
129
-
130
-
131
-
132
-
133
-
134
-
135
-
136
-
137
-
138
-
139
-
140
-
141
-
142
-
143
-
144
-
145
-
146
-
147
-
148
-
149
-
150
-
151
-
152
-
153
-
154
-
155
-
156
-
157
-
158
-
159
-
160
-
161
-
162
-
163
-
164
-
165
-
166
-
167
-
168
-
169
-
170
-
171
-
172
-
173
-
174
-
175
-
176
-
177
-
178
-
179
-
180
 |
 |

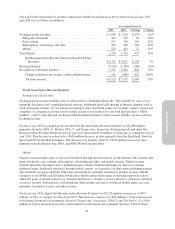
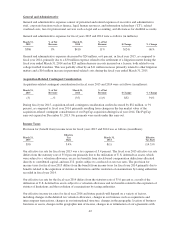
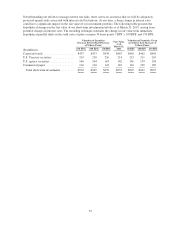
Supplemental Non-GAAP Net Revenue by Revenue Composition
Our non-GAAP net revenue by revenue composition and the reconciliation to net revenue for fiscal years 2014
and 2013 was as follows (in millions):
Year Ended March 31,
2014 2013 $ Change % Change
Packaged goods and other ................................... $2,228 $ 2,130 $ 98 5%
Full-game downloads ..................................... 323 221 102 46%
Extra content ........................................... 760 654 106 16%
Subscriptions, advertising, and other ......................... 258 425 (167) (39)%
Mobile ................................................ 452 363 89 25%
Total Digital .............................................. 1,793 1,663 130 8%
Net Revenue before Revenue Deferral (Non-GAAP Net
Revenue) ........................................... $4,021 $ 3,793 $ 228 6%
Revenue Deferral .......................................... (3,350) (3,022) (328) (11)%
Recognition of Revenue Deferral .............................. 2,904 3,026 (122) (4)%
Change in deferred net revenue (online-enabled games) ........ (446) 4 (450) (11,250)%
Total net revenue ...................................... $3,575 $ 3,797 $(222) (6)%
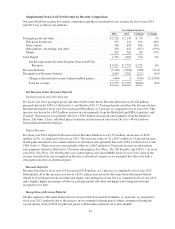
Net Revenue before Revenue Deferral
Packaged goods and other Revenue
For fiscal year 2014, packaged goods and other Net Revenue before Revenue Deferral was $2,228 million,
primarily driven by FIFA 14,Battlefield 4, and Madden NFL 25. Packaged goods and other Net Revenue before
Revenue Deferral for fiscal year 2014 increased $98 million, or 5 percent, as compared to fiscal year 2013. This
increase was driven by a $653 million increase in sales primarily from the Battlefield and FIFA franchises, and
Titanfall. This increase was partially offset by a $555 million decrease in sales primarily from the Medal of
Honor, The Sims, Crysis, and Dead Space franchises and decrease in sales from The Secret World and our
Switzerland distribution business.
Digital Revenue
For fiscal year 2014, digital Net Revenue before Revenue Deferral was $1,793 million, an increase of $130
million, or 8%, as compared to fiscal year 2013. This increase is due to (1) a $297 million or 24 percent increase
in full-game download, extra content and free-to-download sales primarily driven by FIFA 14,Battlefield 4, and
FIFA Online 3. These increases were partially offset by a $167 million or 39 percent decrease in subscription
sales primarily driven by Battlefield 3 Premium subscription, Star Wars: The Old Republic and FIFA 13. In fiscal
year 2013, Star Wars: The Old Republic was a subscription-only based MMO. In fiscal year 2014, some of the
revenue from this title was recognized in the free-to-download category as we expanded this title to be both a
subscription and free-to-download game.
Revenue Deferral
Revenue Deferral for fiscal year 2014 increased $328 million, or 11 percent, as compared to fiscal year 2013.
Substantially all of this increase was due to a $251 million increase in Net Revenue before Revenue Deferral
related to our packaged goods and other and digital sales during fiscal year 2014 as compared to fiscal year 2013,
and a slightly higher percentage of both our packaged goods and other and digital sales being deferred and
recognized over time.
Recognition of Revenue Deferral
The Recognition of Revenue Deferral for fiscal year 2014 decreased $122 million, or 4 percent, as compared to
fiscal year 2013, primarily due to the increase in our estimated offering period, which commenced during the
second quarter of fiscal 2014 for physical games sold through retail from six to nine months.
44