Electronic Arts 2015 Annual Report Download - page 147
Download and view the complete annual report
Please find page 147 of the 2015 Electronic Arts annual report below. You can navigate through the pages in the report by either clicking on the pages listed below, or by using the keyword search tool below to find specific information within the annual report.-
 1
1 -
2
-
3
-
4
-
5
-
6
-
7
-
8
-
9
-
10
-
11
-
12
-
13
-
14
-
15
-
16
-
17
-
18
-
19
-
20
-
21
-
22
-
23
-
24
-
25
-
26
-
27
-
28
-
29
-
30
-
31
-
32
-
33
-
34
-
35
-
36
-
37
-
38
-
39
-
40
-
41
-
42
-
43
-
44
-
45
-
46
-
47
-
48
-
49
-
50
-
51
-
52
-
53
-
54
-
55
-
56
-
57
-
58
-
59
-
60
-
61
-
62
-
63
-
64
-
65
-
66
-
67
-
68
-
69
-
70
-
71
-
72
-
73
-
74
-
75
-
76
-
77
-
78
-
79
-
80
-
81
-
82
-
83
-
84
-
85
-
86
-
87
-
88
-
89
-
90
-
91
-
92
-
93
-
94
-
95
-
96
-
97
-
98
-
99
-
100
-
101
-
102
-
103
-
104
-
105
-
106
-
107
-
108
-
109
-
110
-
111
-
112
-
113
-
114
-
115
-
116
-
117
-
118
-
119
-
120
-
121
-
122
-
123
-
124
-
125
-
126
-
127
-
128
-
129
-
130
-
131
-
132
-
133
-
134
-
135
-
136
-
 137
137 -
 138
138 -
 139
139 -
 140
140 -
 141
141 -
 142
142 -
 143
143 -
 144
144 -
 145
145 -
 146
146 -
 147
147 -
 148
148 -
 149
149 -
 150
150 -
 151
151 -
 152
152 -
 153
153 -
 154
154 -
 155
155 -
 156
156 -
 157
157 -
158
-
159
-
160
-
161
-
162
-
163
-
164
-
165
-
166
-
167
-
168
-
169
-
170
-
171
-
172
-
173
-
174
-
175
-
176
-
177
-
178
-
179
-
180
 |
 |

Annual Report
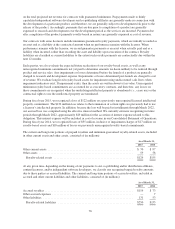
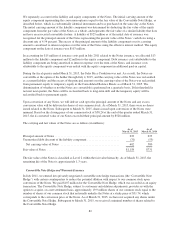
As of March 31, 2015, we were committed to pay approximately $1,584 million to content licensors, independent
software developers, and co-publishing and/or distribution affiliates, but performance remained with the
counterparty (i.e., delivery of the product or content or other factors) and such commitments were therefore not
recorded in our Consolidated Financial Statements. See Note 13 for further information on our developer and
licensor commitments.
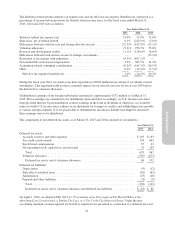
(10) BALANCE SHEET DETAILS
Inventories
Inventories as of March 31, 2015 and 2014 consisted of (in millions):
As of March 31,
2015 2014
Finished goods .............................................................. $35 $55
Raw materials and work in process .............................................. 1 1
Inventories ............................................................... $36 $56
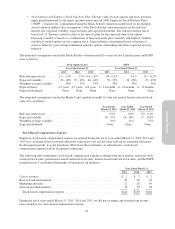
Property and Equipment, Net
Property and equipment, net, as of March 31, 2015 and 2014 consisted of (in millions):
As of March 31,
2015 2014
Computer, equipment and software .............................................. $ 655 $ 718
Buildings .................................................................. 315 327
Leasehold improvements ...................................................... 126 129
Office equipment, furniture and fixtures .......................................... 64 67
Land ...................................................................... 62 63
Warehouse, equipment and other ............................................... 9 10
Construction in progress ...................................................... 7 5
1,238 1,319
Less: accumulated depreciation ................................................. (779) (809)
Property and equipment, net ................................................. $ 459 $ 510
Depreciation expense associated with property and equipment was $126 million, $126 million and $118 million
for the fiscal years ended March 31, 2015, 2014 and 2013, respectively.
Accrued and Other Current Liabilities
Accrued and other current liabilities as of March 31, 2015 and 2014 consisted of (in millions):
As of March 31,
2015 2014
Other accrued expenses ....................................................... $298 $328
Accrued compensation and benefits ............................................. 263 259
Accrued royalties ............................................................ 119 73
Deferred net revenue (other) ................................................... 114 121
Accrued and other current liabilities ........................................... $794 $781
Deferred net revenue (other) includes the deferral of subscription revenue, deferrals related to our Switzerland
distribution business, advertising revenue, licensing arrangements, and other revenue for which revenue
recognition criteria has not been met.
77