Electronic Arts 2015 Annual Report Download - page 111
Download and view the complete annual report
Please find page 111 of the 2015 Electronic Arts annual report below. You can navigate through the pages in the report by either clicking on the pages listed below, or by using the keyword search tool below to find specific information within the annual report.-
 1
1 -
2
-
3
-
4
-
5
-
6
-
7
-
8
-
9
-
10
-
11
-
12
-
13
-
14
-
15
-
16
-
17
-
18
-
19
-
20
-
21
-
22
-
23
-
24
-
25
-
26
-
27
-
28
-
29
-
30
-
31
-
32
-
33
-
34
-
35
-
36
-
37
-
38
-
39
-
40
-
41
-
42
-
43
-
44
-
45
-
46
-
47
-
48
-
49
-
50
-
51
-
52
-
53
-
54
-
55
-
56
-
57
-
58
-
59
-
60
-
61
-
62
-
63
-
64
-
65
-
66
-
67
-
68
-
69
-
70
-
71
-
72
-
73
-
74
-
75
-
76
-
77
-
78
-
79
-
80
-
81
-
82
-
83
-
84
-
85
-
86
-
87
-
88
-
89
-
90
-
91
-
92
-
93
-
94
-
95
-
96
-
97
-
98
-
99
-
100
-
 101
101 -
 102
102 -
 103
103 -
 104
104 -
 105
105 -
 106
106 -
 107
107 -
 108
108 -
 109
109 -
 110
110 -
 111
111 -
 112
112 -
 113
113 -
 114
114 -
 115
115 -
 116
116 -
 117
117 -
 118
118 -
 119
119 -
 120
120 -
 121
121 -
122
-
123
-
124
-
125
-
126
-
127
-
128
-
129
-
130
-
131
-
132
-
133
-
134
-
135
-
136
-
137
-
138
-
139
-
140
-
141
-
142
-
143
-
144
-
145
-
146
-
147
-
148
-
149
-
150
-
151
-
152
-
153
-
154
-
155
-
156
-
157
-
158
-
159
-
160
-
161
-
162
-
163
-
164
-
165
-
166
-
167
-
168
-
169
-
170
-
171
-
172
-
173
-
174
-
175
-
176
-
177
-
178
-
179
-
180
 |
 |

Annual Report
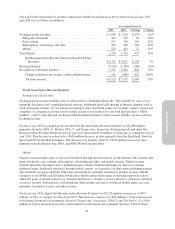
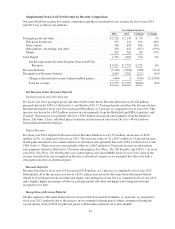
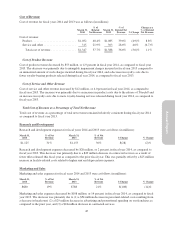
Cost of service and other revenue increased by $86 million, or 27.3 percent in fiscal year 2015, as compared to
fiscal year 2014. The increase was primarily due to an increase in royalty-related costs due to FIFA Ultimate
Team,Madden Ultimate Team, and Titanfall.
Total Cost of Revenue as a Percentage of Total Net Revenue
During the fiscal year ended March 31, 2015, total cost of revenue as a percentage of total net revenue decreased
by 6.0 percent as compared to the fiscal year ended March 31, 2014. Excluding the loss of $122 million on
previously unrecognized license intellectual property recognized during three months ended June 30, 2014, total
cost of revenue as a percentage of total net revenue decreased 8.8 percent as a result of an increase in our digital
products and services that generally have a lower cost than our packaged goods and other products.
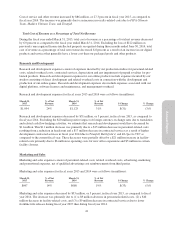
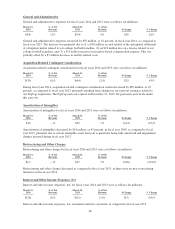
Research and Development
Research and development expenses consist of expenses incurred by our production studios for personnel-related
costs, related overhead costs, contracted services, depreciation and any impairment of prepaid royalties for pre-
launch products. Research and development expenses for our online products include expenses incurred by our
studios consisting of direct development and related overhead costs in connection with the development and
production of our online games. Research and development expenses also include expenses associated with our
digital platform, software licenses and maintenance, and management overhead.
Research and development expenses for fiscal years 2015 and 2014 were as follows (in millions):
March 31,
2015
% of Net
Revenue
March 31,
2014
% of Net
Revenue $ Change % Change
$1,094 24% $1,125 31% $(31) (3)%
Research and development expenses decreased by $31 million, or 3 percent, in fiscal year 2015, as compared to
fiscal year 2014. Excluding the $20 million positive impact of foreign currency exchange rates due to translation
and related cash flow hedging activities, we estimate that research and development would have decreased by
$11 million. This $11 million decrease was primarily due to a $15 million decrease in personnel-related costs
resulting from a reduction in headcount and a $17 million decrease in contracted services as a result of higher
development contracted services in fiscal year 2014 due to Titanfall,Battlefield 4, and EA Sports UFC as
compared to the current fiscal year. These decreases were partially offset by a $21 million increase in facility-
related costs primarily due to $6 million in operating costs for new office expansions and $5 million in certain
facility closures.
Marketing and Sales
Marketing and sales expenses consist of personnel-related costs, related overhead costs, advertising, marketing
and promotional expenses, net of qualified advertising cost reimbursements from third parties.
Marketing and sales expenses for fiscal years 2015 and 2014 were as follows (in millions):
March 31,
2015
% of Net
Revenue
March 31,
2014
% of Net
Revenue $ Change % Change
$647 14% $680 19% $(33) (5)%
Marketing and sales expenses decreased by $33 million, or 5 percent, in fiscal year 2015, as compared to fiscal
year 2014. The decrease was primarily due to (1) a $9 million decrease in personnel-related costs, (2) a $10
million decrease in facility-related costs, and (3) a $9 million decrease in contracted services due to fewer
frontline title releases during fiscal year 2015 than during fiscal year 2014.
41